Published: 2026-08-03T05:54:35.000Z
Chart USD/IDR Updates: Leaning lower from 18090 high
2
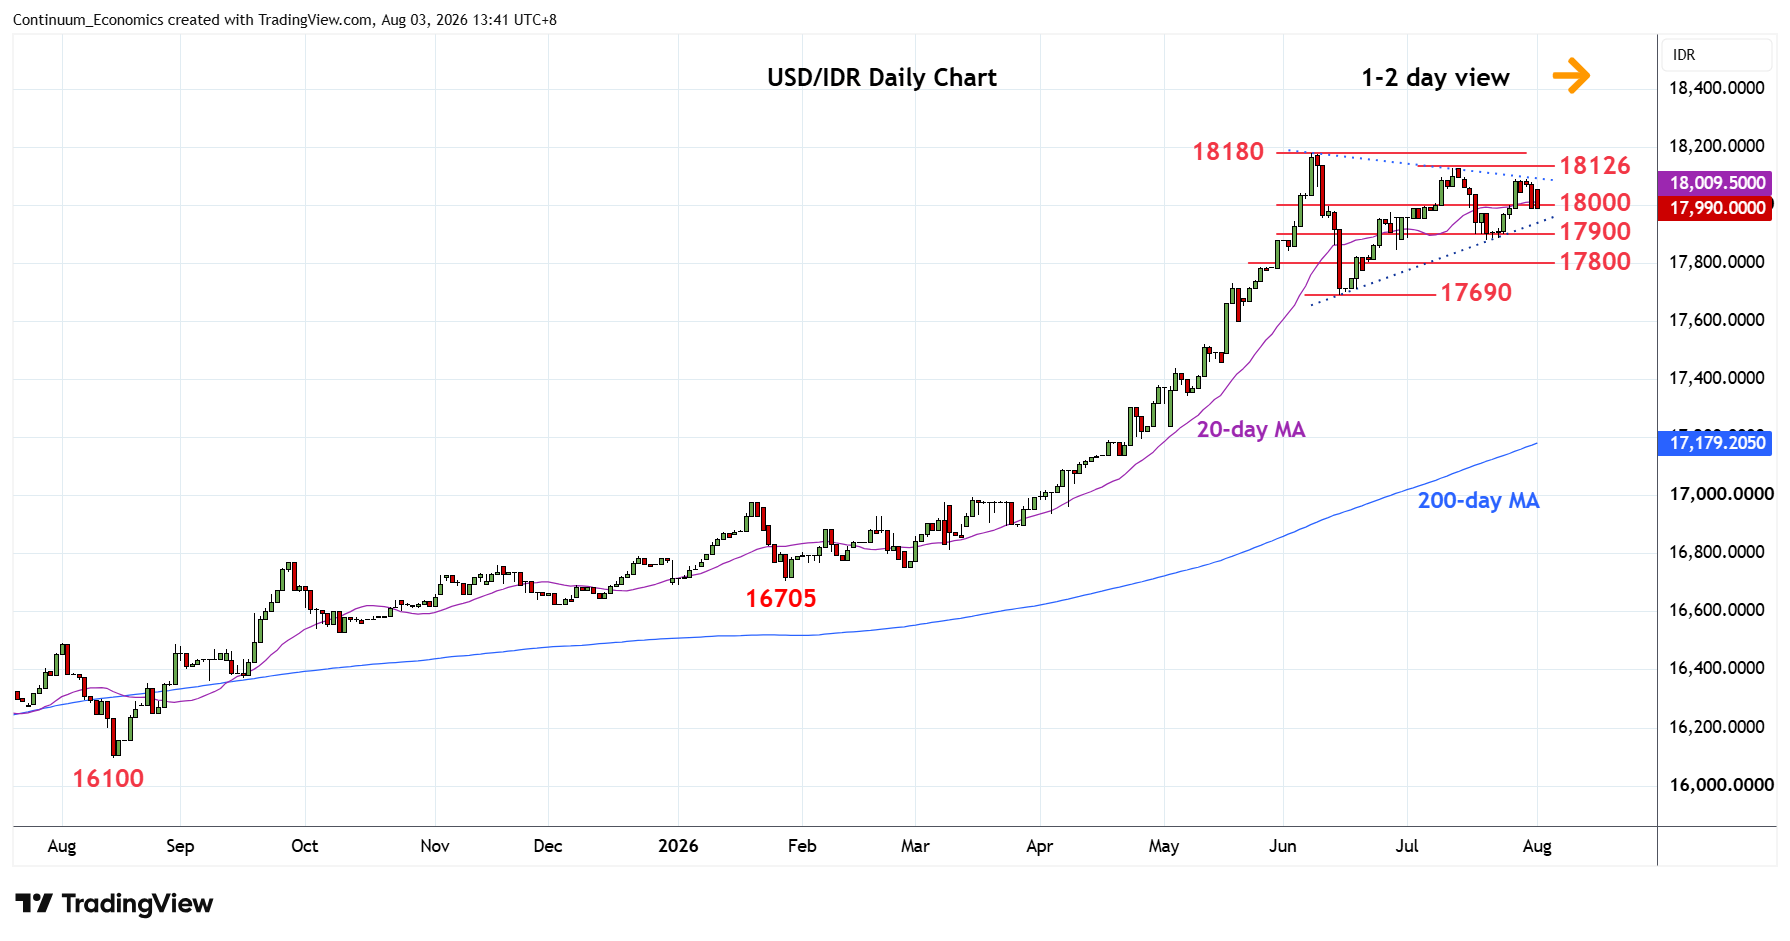
Lower in range from the 18090 high of last week to retest support at 17990
| Levels | Imp | Comment | Levels | Imp | Comment | |||
|---|---|---|---|---|---|---|---|---|
| R4 | 18200 | projection | S1 | 17990 | * | 28 Jul low | ||
| R3 | 18180 | ** | 8 Jun all-time high | S2 | 17880 | ** | 21 Jul low | |
| R2 | 18126 | ** | 13 Jul high | S3 | 17845 | * | 29 Jun low | |
| R1 | 18090 | * | 28 Jul high | S4 | 17800 | * | congestion |
Asterisk denotes strength of level
05:45 GMT - Lower in range from the 18090 high of last week to retest support at 17990. The 2-month triangle pattern from the 18180 June all-time high see scope for pullback to retest support at the 17900/17880 lows. Would take break here to turn focus lower and see deeper correction to the 17800 support and 17690 June low. Meanwhile, resistance is at the 18090 and 18126 highs are expected to cap. Break of these will expose the 18180 high to retest and see room for extension of the underlying bull trend.