Chartbook: Chart USD Index DXY: Choppy in range - room to extend January gains
Anticipated tests higher posted a fresh year high at 100.64
Anticipated tests higher posted a fresh year high at 100.64.
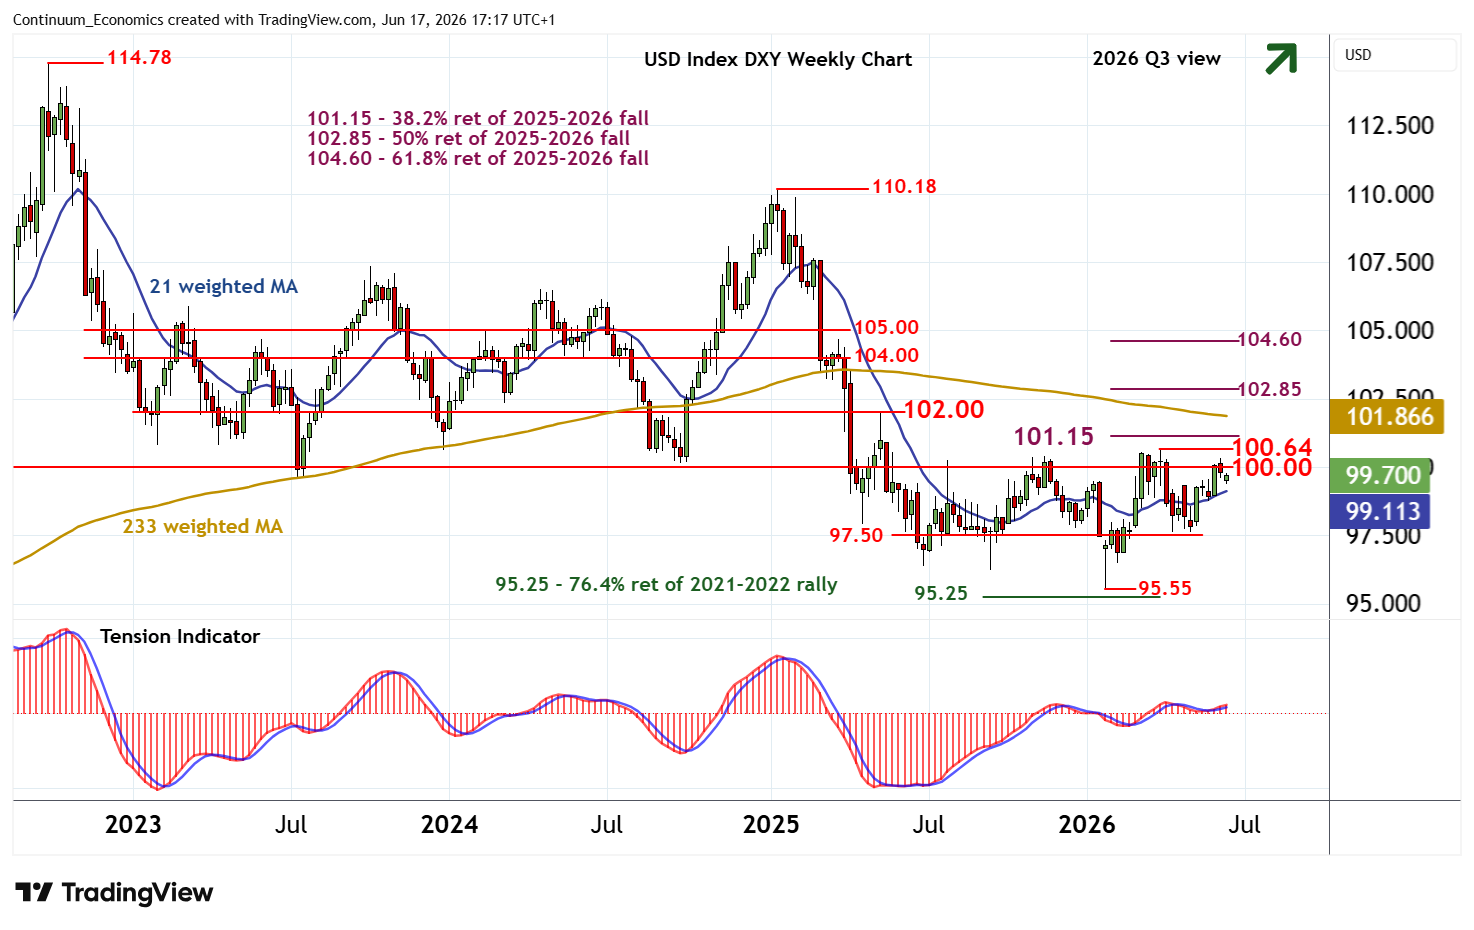
Prices then fell steadily to reach support at the 97.50 multi-week range lows, before bouncing back to 100.00.
Weekly stochastics are rising and the weekly Tension Indicator is also improving, highlighting room for fresh gains in the coming weeks.
Resistance is at the 100.00 break level. But a close above the 100.64 current year high of 31 March would turn sentiment positive and extend gains from the 95.55 current year low of 27 January towards the 101.25 Fibonacci retracement.
Weekly stochastics are already approaching overbought areas, suggesting any initial tests of here could give way to fresh consolidation, before rising monthly charts prompt a break and open up congestion around 102.00.
Meanwhile, support is at the 97.50 multi-week range lows.
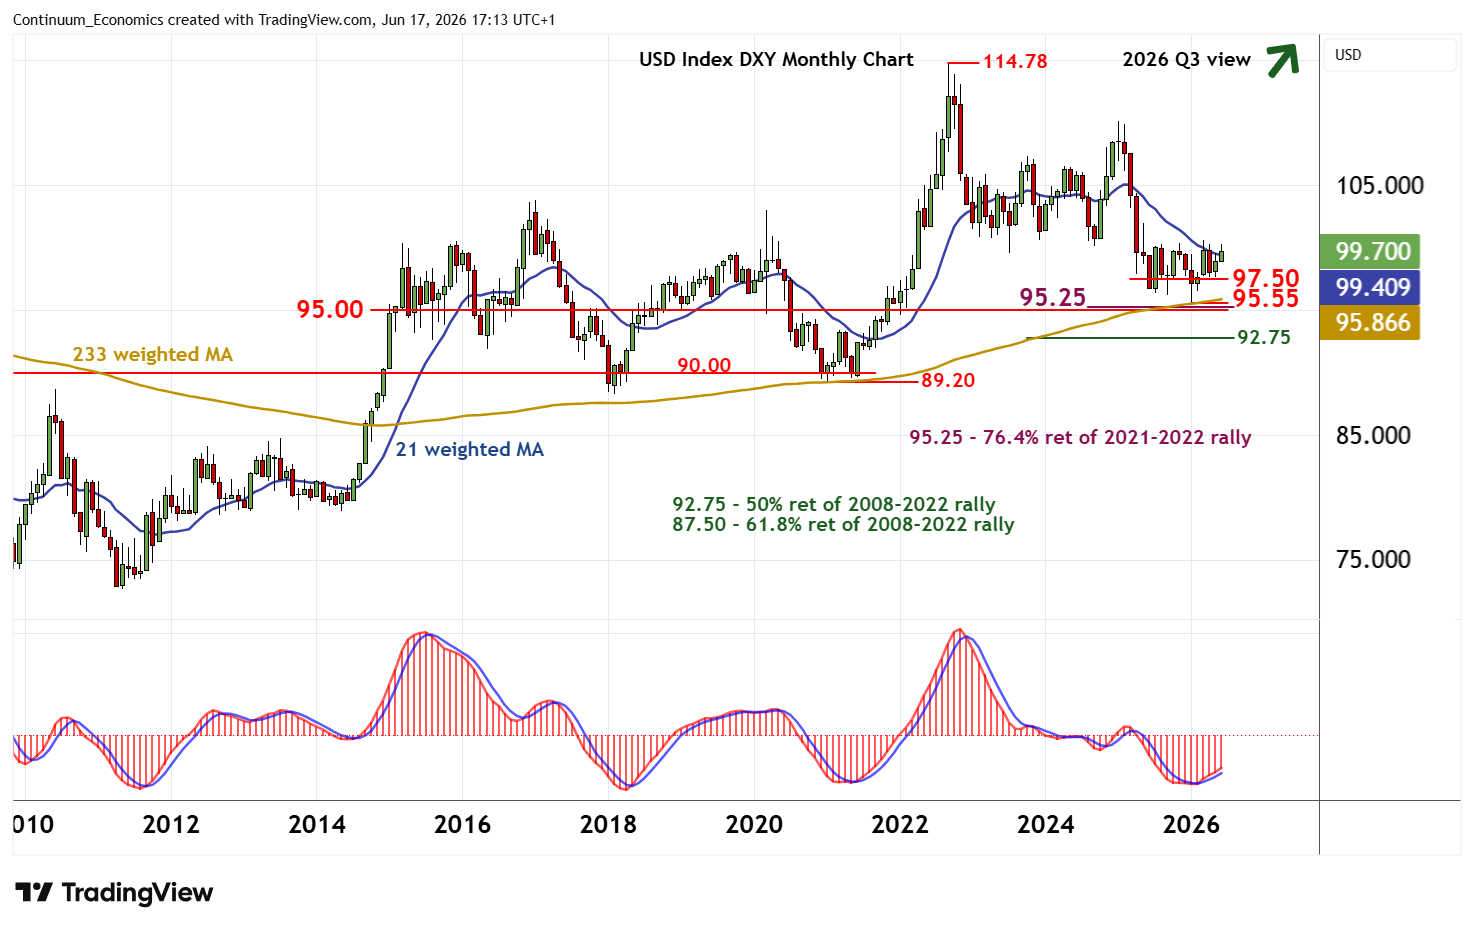
Rising monthly studies should limit any fresh pullbacks in buying interest above here.
However, a break, if seen, will open up critical support within congestion around 95.00, the 95.25 Fibonacci retracement and the 95.55 current year low of 27 January.
From a longer-term perspective, multi-month studies are falling, classifying the current bounce from the January low as a correction.
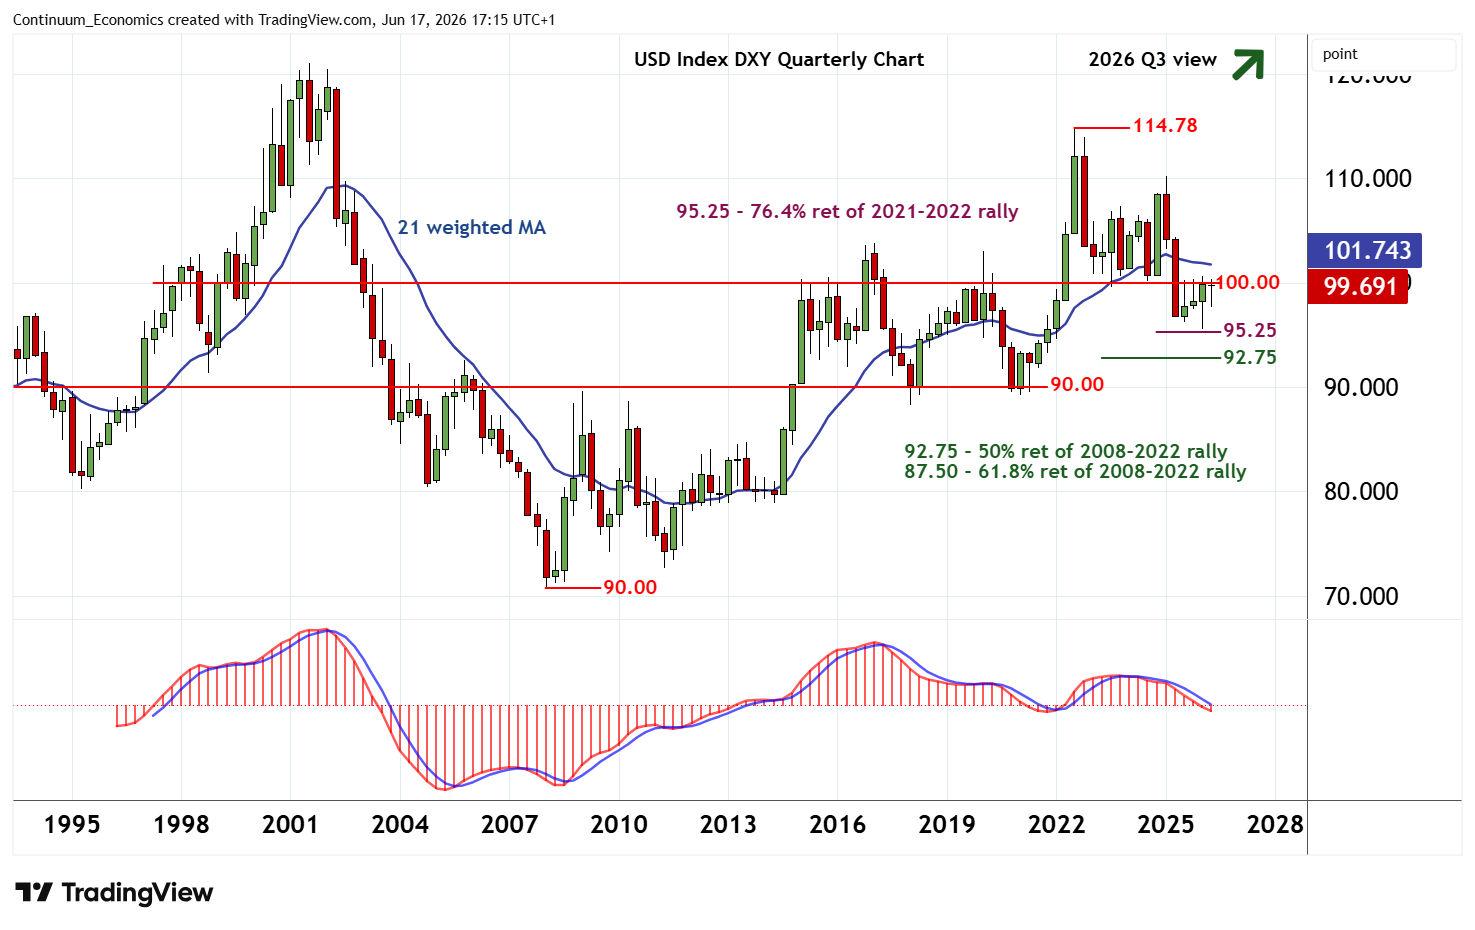
A close below the 95.25 retracement is needed to confirm continuation of the bear trend from the 114.78 monthly high of September 2022 and open up the 92.75 multi-year Fibonacci retracement.