Published: 2026-06-18T04:52:44.000Z
Chart USD/INR Update: Still room to extend losses
-
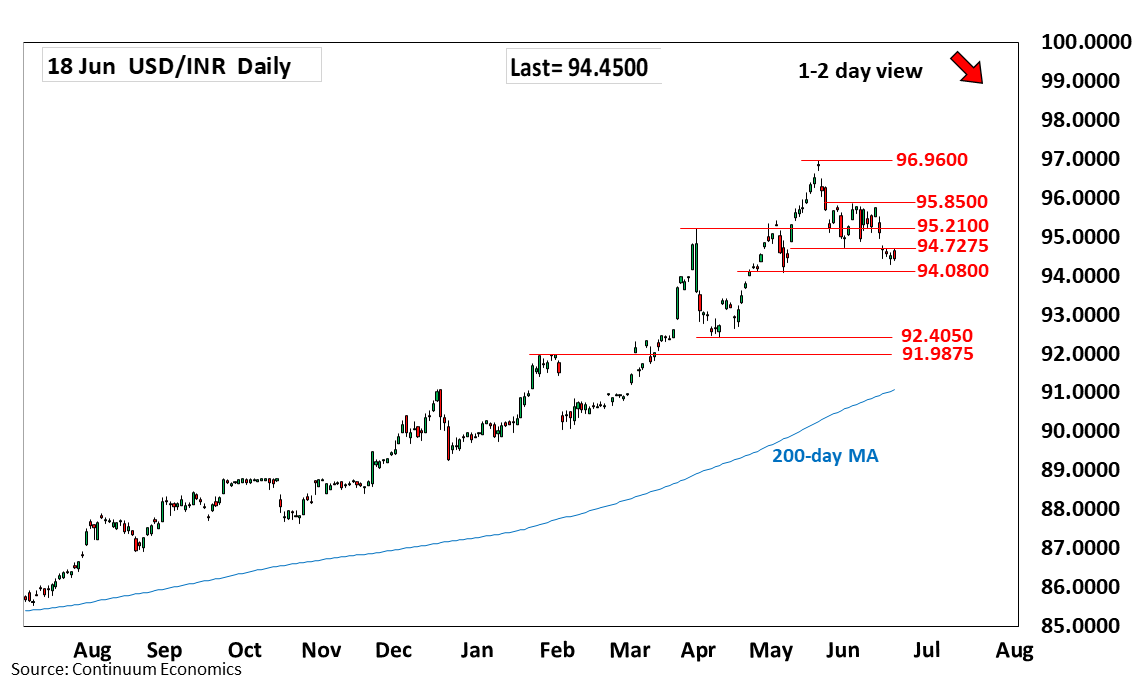
Turned up from the 94.2825 low as prices consolidate losses from the 95.8500, 3 June high
| Level | Comment | Level | Comment | |||||
|---|---|---|---|---|---|---|---|---|
| R4 | 96.9600 | ** | 20 May all-time high | S1 | 94.2825 | * | 17 Jun low | |
| R3 | 96.0000 | * | figure | S2 | 94.0800 | ** | May low | |
| R2 | 95.8500 | ** | 3 Jun high | S3 | 93.4100 | ** | 15 Apr high | |
| R1 | 95.2100 | * | Mar high | S4 | 93.0000 | * | figure, congestion |
Asterisk denotes strength of level
05:00 GMT - Turned up from the 94.2825 low as prices consolidate losses from the 95.8500, 3 June high. However, the downside remains vulnerable and lower will see room to further retrace gains from the April low to strong support at the 94.0800/94.0000 area. Below this will open up room for deeper pullback to support at 93.4100 then the 93.0000 figure. Meanwhile, resistance at the 95.2100 March high is expected to cap. Break here will open up room for stronger gains to retest of resistance at 95.8500.