Chart USD/CNH Update: Turning higher
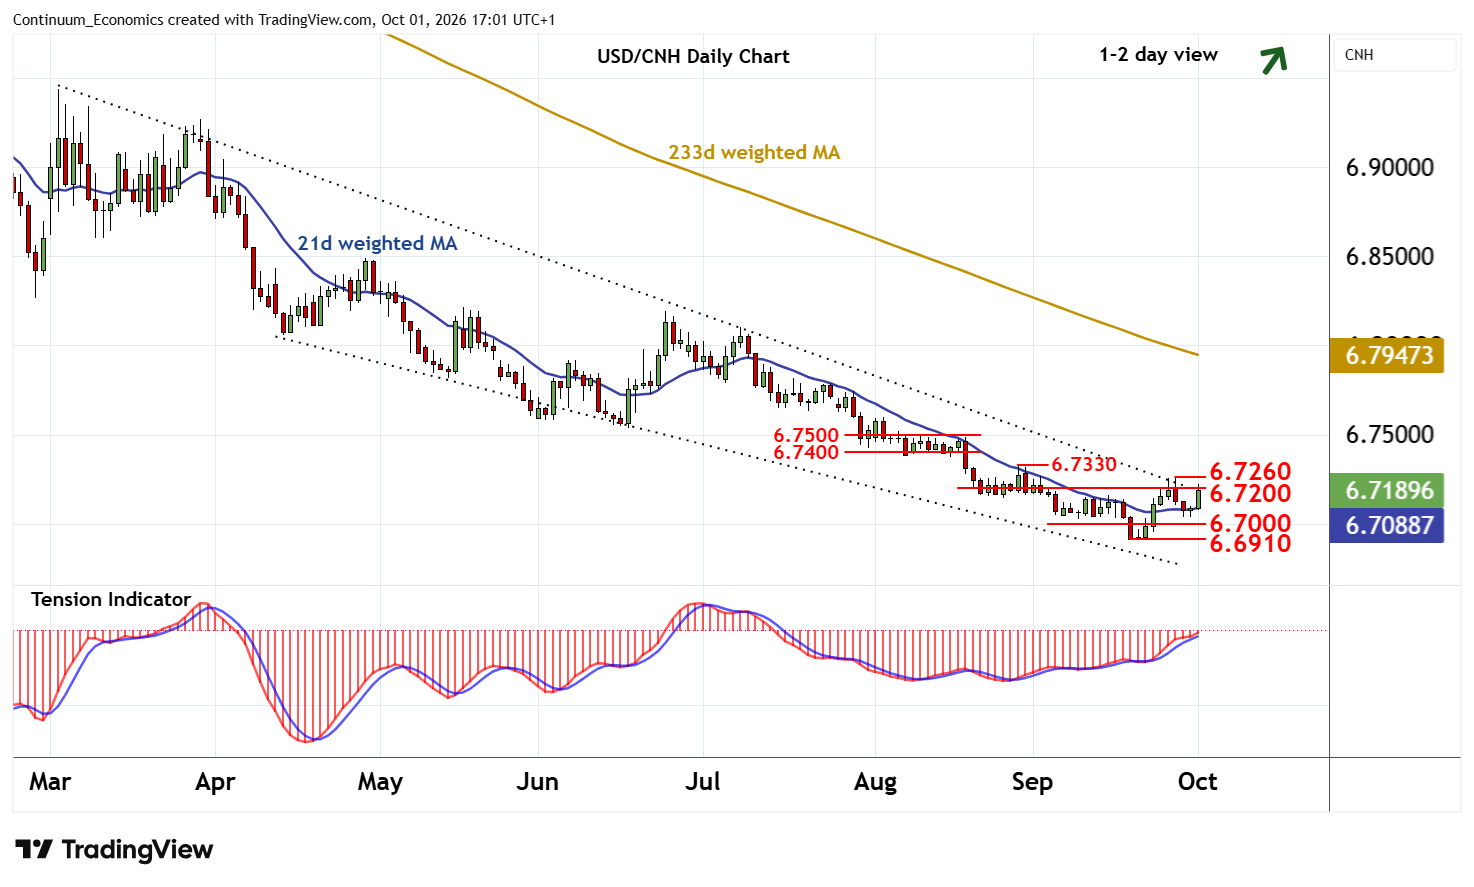
The anticipated bounce has reached congestion resistance at 6.7200
| Level | Imp | Comment | Level | Imp | Comment | |||
|---|---|---|---|---|---|---|---|---|
| R4 | 6.7400 | * | 7 Aug low, congestion | S1 | 6.7000 | * | congestion | |
| R3 | 6.7330 | * | 28 Aug (w) high | S2 | 6.6910 | ** | 21 Sep YTD low | |
| R2 | 6.7260 | * | 28 Sep (m) high | S3 | 6.6700 | ** | 2023 year low | |
| R1 | 6.7200 | * | congestion | S4 | 6.6500 | * | congestion |
Asterisk denotes strength of level
16:50 BST - The anticipated bounce has reached congestion resistance at 6.7200, where overbought intraday studies are prompting fresh consolidation. Daily readings have ticked higher and broader weekly charts are improving, suggesting room for a later break towards the 6.7260 monthly high of 28 September. A close above here will improve price action and extend gains from the 6.6910 current year low of 21 September initially to the 6.7330 weekly high of 28 August.
Meanwhile, support remains at 6.7000 and should underpin any immediate tests lower. However, a further close below critical support at the 6.6910 current year low 21 September will turn sentiment negative and extend broad losses towards the 6.6700 low of 2023.