Published: 2026-11-10T07:19:37.000Z
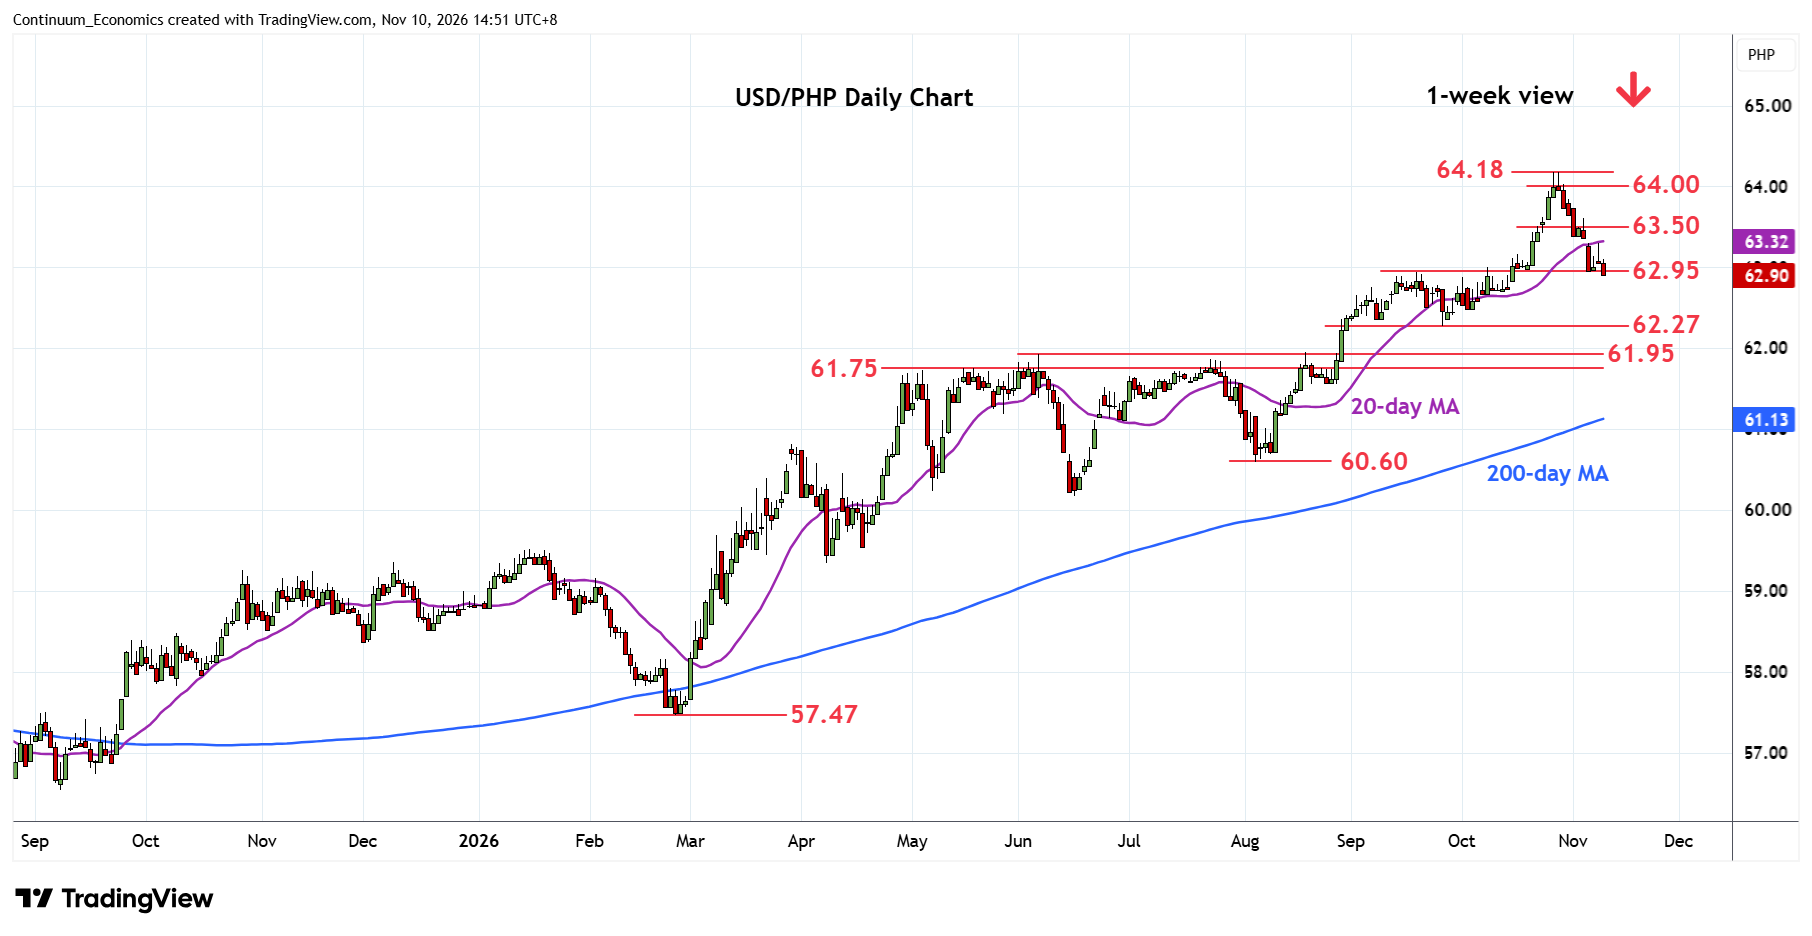
Chart USD/PHP Updates: Extending losses from 64.180, all-time high
1
Under pressure, as prices extend losses from the 64.180 all-time high to retrace gains from the 57.470 February current year low
| Level | Comment | Level | Comment | |||||
|---|---|---|---|---|---|---|---|---|
| R4 | 64.180 | ** | 27 Oct all-time high | S1 | 62.500 | * | congestion | |
| R3 | 64.000 | * | congestion | S2 | 62.270 | ** | Sep low | |
| R2 | 63.500 | * | congestion | S3 | 62.000 | * | congestion | |
| R1 | 63.300 | * | 9 Nov high | S4 | 61.950 | ** | Jun high |
Asterisk denotes strength of level
07:15 GMT - Under pressure, as prices extend losses from the 64.180 all-time high to retrace gains from the 57.470 February current year low. Daily and weekly studies are tracking lower from overbought areas and break of the 63.000/62.950 support opens up room for deeper correction to the 62.500 congestion and 62.270, September low. Meanwhile, resistance at the 63.300 high of 9 November high and extending to 63.500 congestion now expected to cap corrective bounce. Would take break here to ease the downside pressure and see scope for retest of the 64.000 figure and 64.180 high.