Published: 2026-07-03T03:03:35.000Z
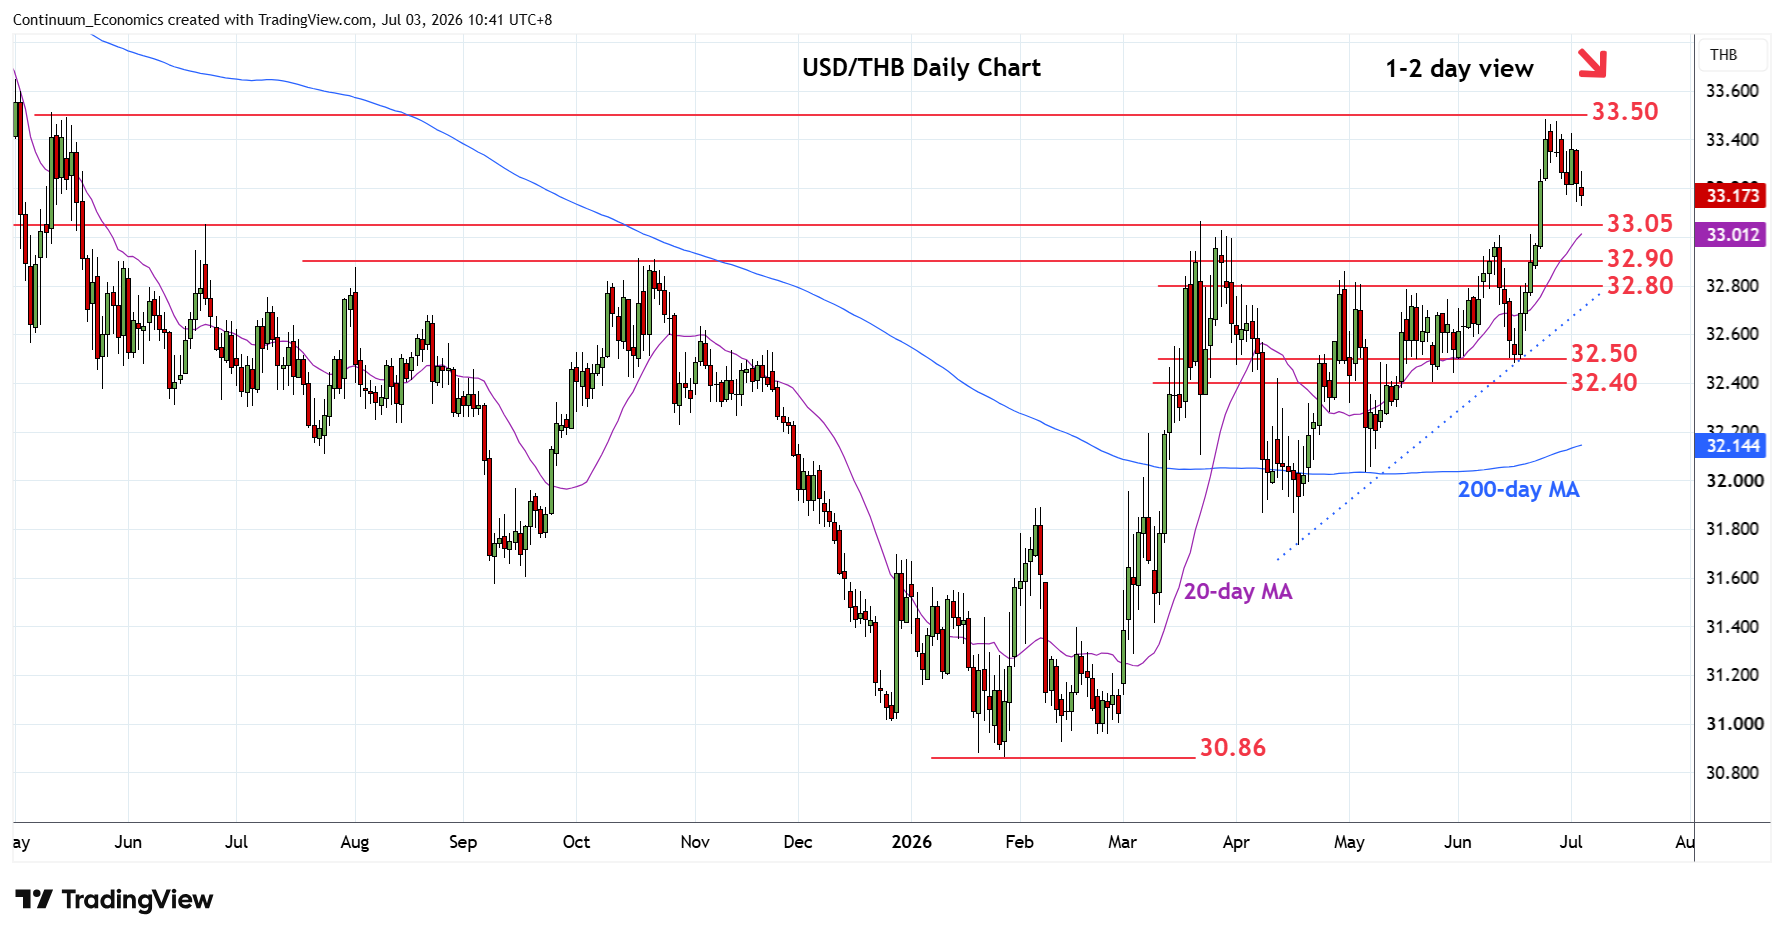
Chart USD/THB Update: Leaning lower from 33.48 high
-
Break of the 33.20 support see prices extending pullnack from the 33.48, June current year high
| Level | Comment | Level | Comment | |||||
|---|---|---|---|---|---|---|---|---|
| R4 | 33.77 | * | 28 Apr 2025 high | S1 | 33.05 | ** | Mar high | |
| R3 | 33.50 | * | congestion | S2 | 32.90 | * | Oct high | |
| R2 | 33.48 | ** | 24 Jun YTD high | S3 | 32.80 | ** | May high, congestion | |
| R1 | 33.40 | congestion | S4 | 32.60 | congestion |
Asterisk denotes strength of level
03:00 GMT - Break of the 33.20 support see prices extending pullnack from the 33.48, June current year high. Daily studies have turned lower to unwind overbought readings and suggest scope for deeper pullback to support at the 33.05 March high. Break of the latter will fade the upside pressure and see room retrace strong gains from 31.74, April swing low. Lower will see scope to support at the 32.90/32.80 congestion area. Meanwhile, resistance is lowered to 33.40 congestion which is expected to sustain pullback from the 33.48 high.