Published: 2026-11-12T03:04:48.000Z
Chart USD/MYR Update: Extending gains
1
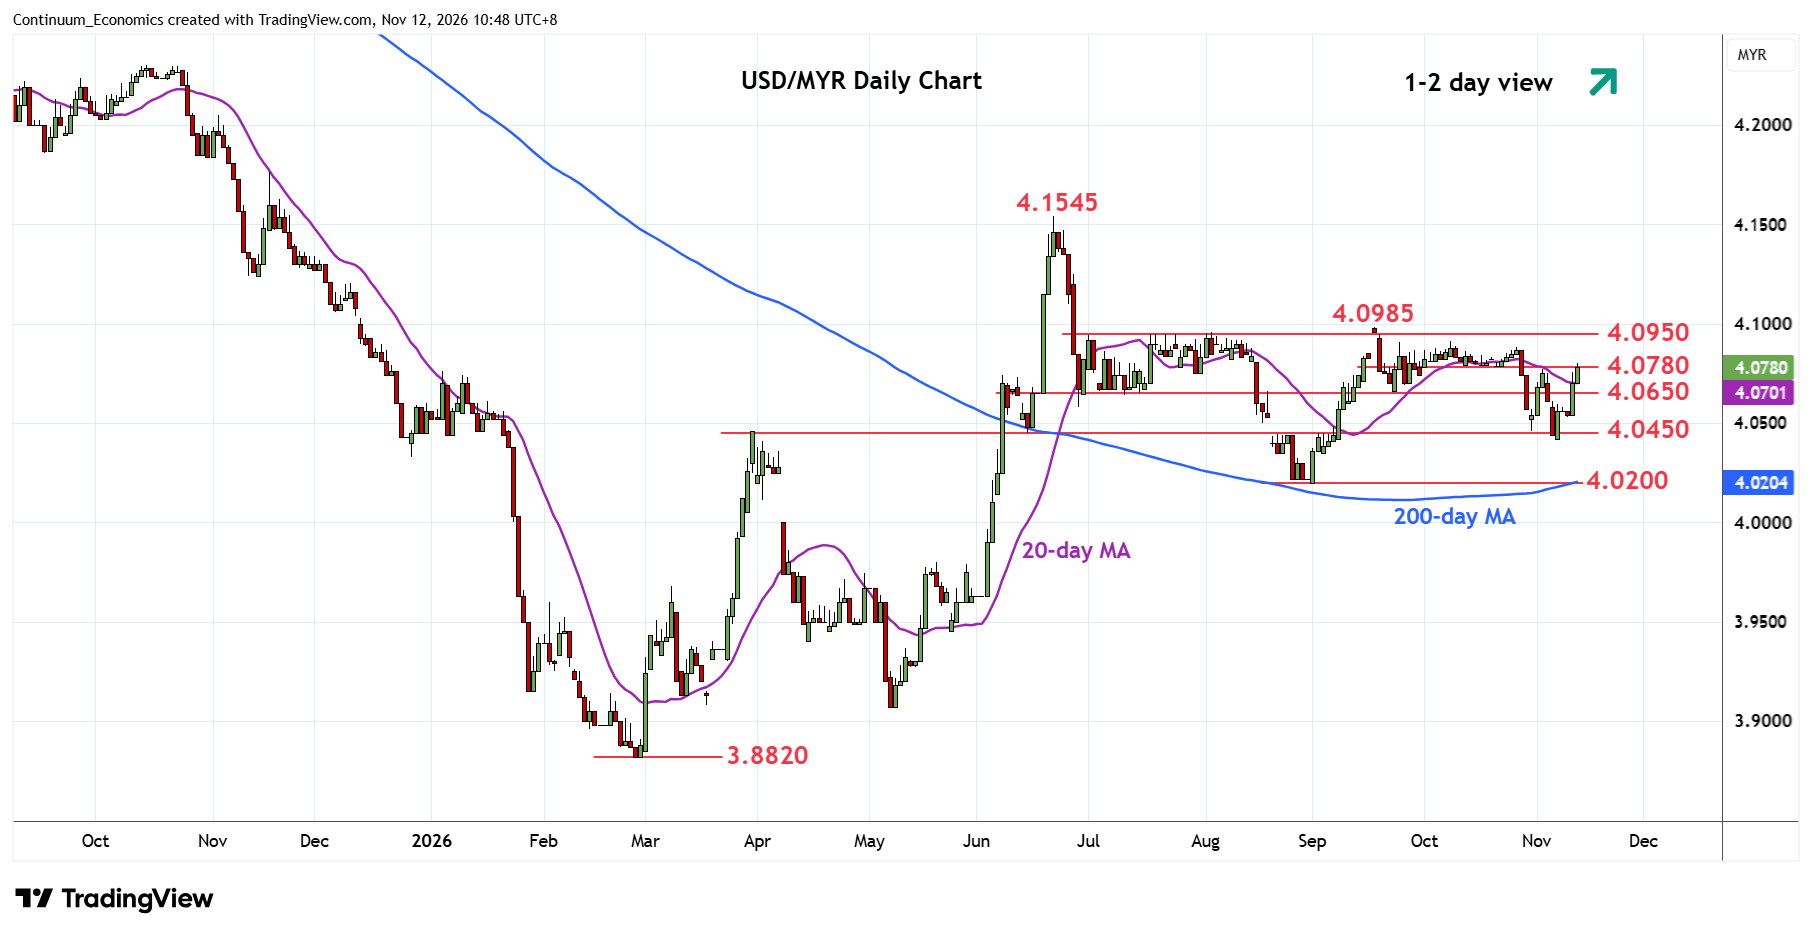
Break above 4.0600/4.0650 resistance see prices extending bounce from the 4.0420 low to reach strong resistance at 4.0780
| Levels | Imp | Comment | Levels | Imp | Comment | |||
|---|---|---|---|---|---|---|---|---|
| R4 | 4.0950 | ** | Jul, Aug highs | S1 | 4.0650/600 | * | congestion | |
| R3 | 4.0915 | * | 8 Oct high | S2 | 4.0420 | ** | 6 Nov low | |
| R2 | 4.0885 | * | 27 Oct high | S3 | 4.0200 | ** | Sep low | |
| R1 | 4.0780 | ** | 21 Oct low | S4 | 3.9800 | ** | May high |
Asterisk denotes strength of level
03:00 GMT - Break above 4.0600/4.0650 resistance see prices extending bounce from the 4.0420 low to reach strong resistance at 4.0780. Break here, will expose the 4.0885 and 4.0915 October highs to retest. Beyond these will return focus to the 4.0950/4.0985 July/September highs to retest. Clearance here will further extend the gains from the September swing low to retrace losses from the 4.1545, June current year high. Meanwhile, support remains at the 4.0650/4.0600 area. Would take break here to return focus to the downside for retest of the 4.0450/4.0420 support.