Published: 2026-06-24T04:32:11.000Z
Chart USD/IDR Updates: Extend corrective bounce
2
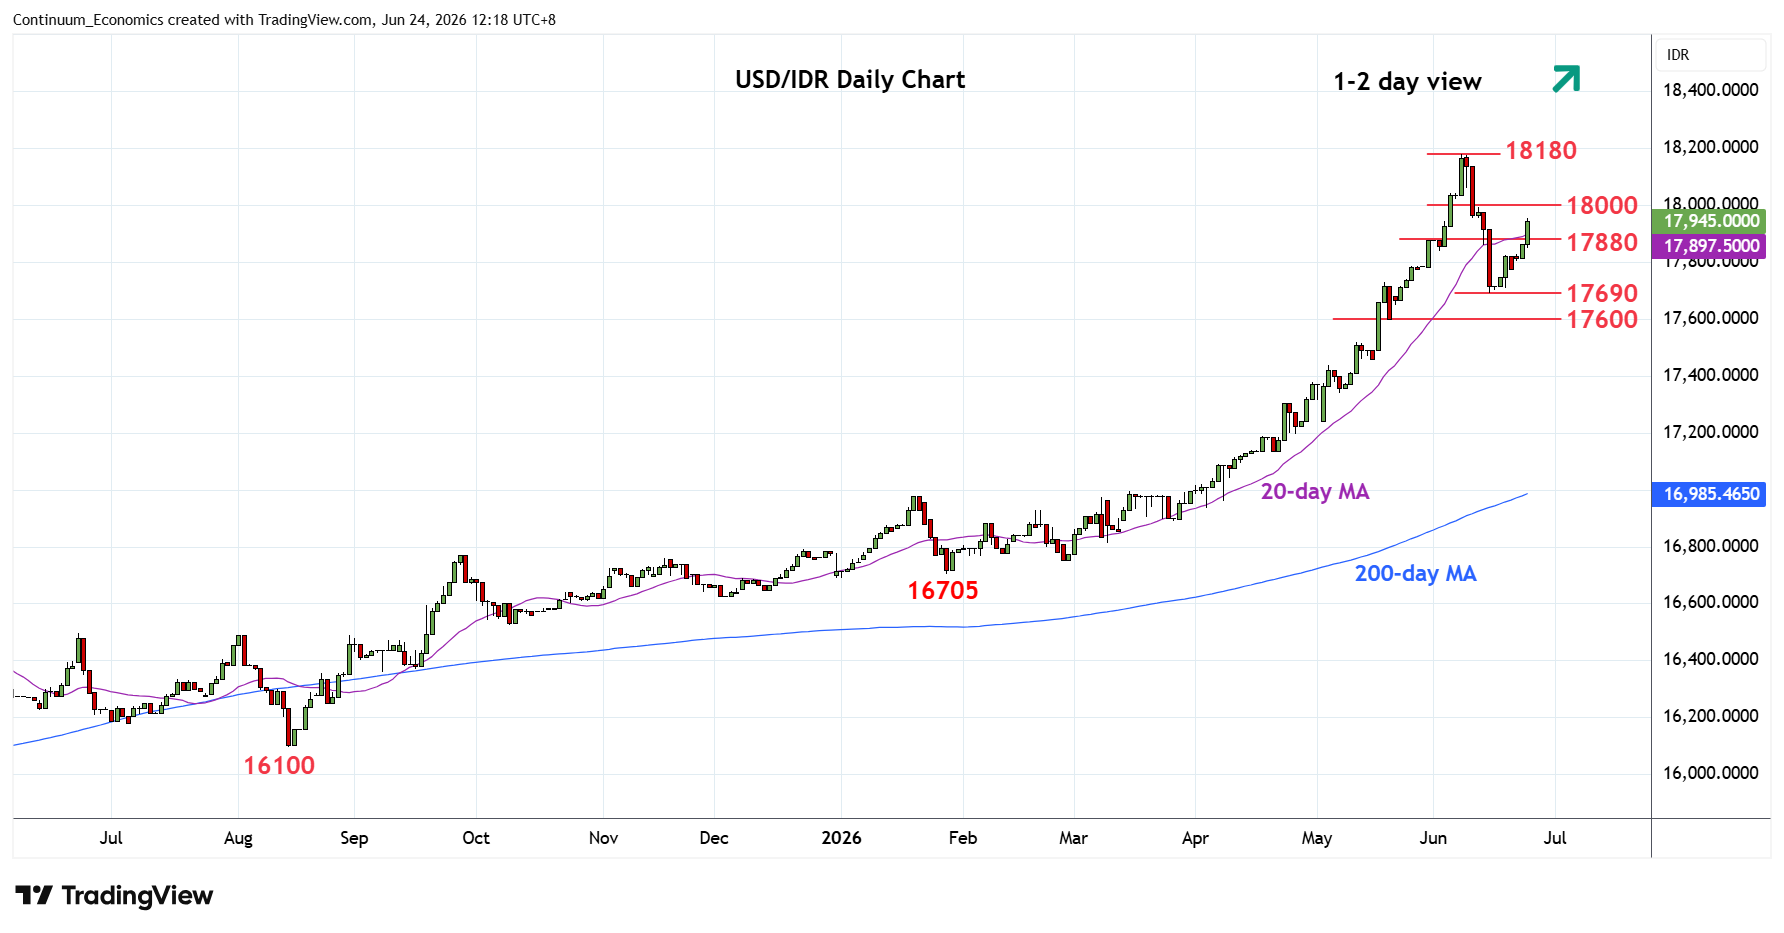
Sharply higher as prices extend bounce from 17690 low to unwind oversold intraday and daily studies
| Levels | Imp | Comment | Levels | Imp | Comment | |||
|---|---|---|---|---|---|---|---|---|
| R4 | 18470 | projection | S1 | 17800 | congestion | |||
| R3 | 18200 | congestion | S2 | 17690 | ** | 15 Jun low | ||
| R2 | 18180 | ** | 8 Jun all-time high | S3 | 17600 | * | 38.2% Jan/Jun rally | |
| R1 | 18000 | * | figure | S4 | 17520 | * | 12 May high |
Asterisk denotes strength of level
04:30 GMT - Sharply higher as prices extend bounce from 17690 low to unwind oversold intraday and daily studies. Break above 17880 resistance see room to the 18000 figure which is expected to cap. Break, if seen, will open up room for retest of the 18180 all-time high. However, gains are seen corrective and lower high sought to pressure the downside later. Meanwhile, support is raised to the 17800 congestion. Below here will see return to 17690 low where break will open up room for deeper pullback to support at 17600, 38.2% Fibonacci level.