Published: 2026-08-13T02:57:18.000Z
Chart USD/TWD Update: Extending losses
2
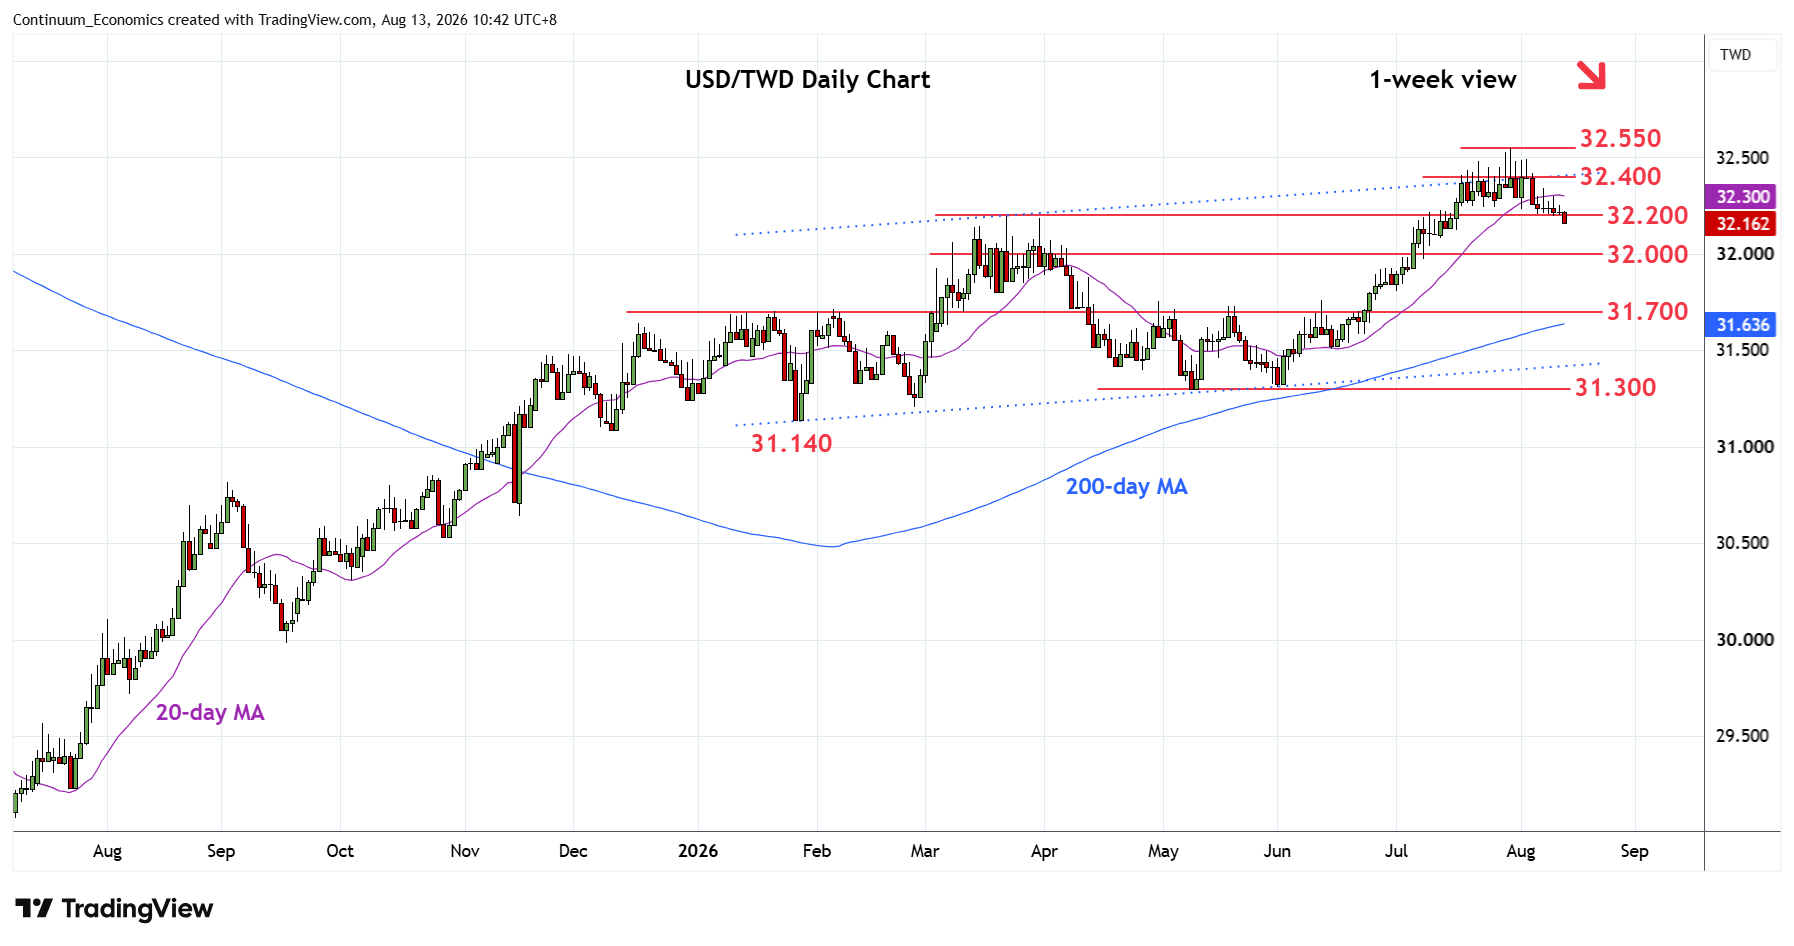
Under pressure, as break of the 32.200 support see prices extending losses from the 32.550, July current year high
| Levels | Imp | Comment | Levels | Imp | Comment | |||
|---|---|---|---|---|---|---|---|---|
| R4 | 32.600 | * | congestion | S1 | 32.100 | * | congestion | |
| R3 | 32.550 | ** | 30 Jul YTD high | S2 | 32.000 | * | congestion | |
| R2 | 32.400 | ** | congestion | S3 | 31.800 | * | congestion | |
| R1 | 32.340 | 7 Aug high | S4 | 31.700 | ** | Jan, Feb highs |
02:50 GMT - Under pressure, as break of the 32.200 support see prices extending losses from the 32.550, July current year high. Daily and weekly studies have turned down to unwind overbought readings and suggest room for deeper pullback to retrace gains from the 31.300, May low. Lower will see room to the 32.100/32.000 congestion area. Below these will open up room to the 31.800 congestion and strong support at 31.700, January/February highs. Meanwhile, resistance is lowered to 32.340/32.400, 7 August high and congestion area which is expected to cap and sustain pullback from the 32.550 high.