Chart EUR/CAD Update: Choppy in range - any gains to remain limited
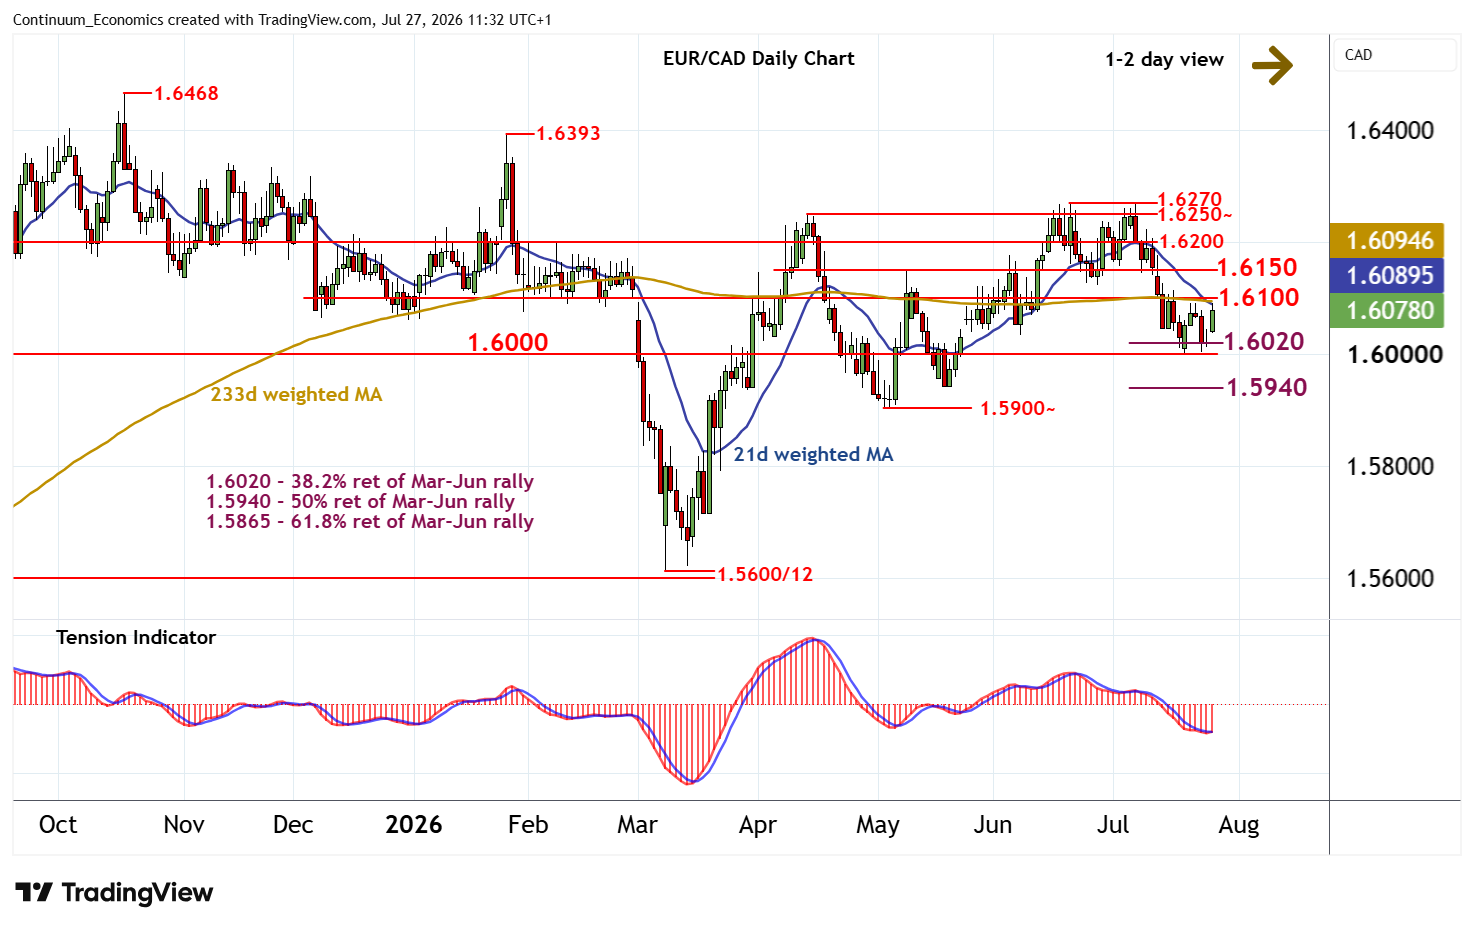
Consolidation following the test of support at congestion around 1.6000 and the 1.6020 Fibonacci retracement is giving way to a bounce
| Level | Comment | Level | Comment | |||||
|---|---|---|---|---|---|---|---|---|
| R4 | 1.6250~ | ** | 14 Apr (m) high | S1 | 1.6020 | * | 38.2% ret of Mar-Jun rally | |
| R3 | 1.6200 | ** | congestion | S2 | 1.6000 | ** | congestion | |
| R2 | 1.6150 | * | break level | S3 | 1.5940 | ** | 50% ret of Mar-Jun rally | |
| R1 | 1.6100 | ** | break level | S4 | 1.5900~ | ** | 4 May (m) low |
Asterisk denotes strength
11:20 BST - Consolidation following the test of support at congestion around 1.6000 and the 1.6020 Fibonacci retracement is giving way to a bounce, as intraday studies rise and oversold daily stochastics turn up, with prices currently trading around 1.6080. A test of resistance at 1.6100 cannot be ruled out. But the flat daily Tension Indicator and bearish weekly charts should limit any break in renewed selling interest beneath 1.6150. Following cautious/corrective trade, fresh losses are looked for. A later close below 1.6000/20 will add weight to sentiment and extend late-June losses towards the 1.5940 retracement.