Published: 2026-09-01T05:18:04.000Z
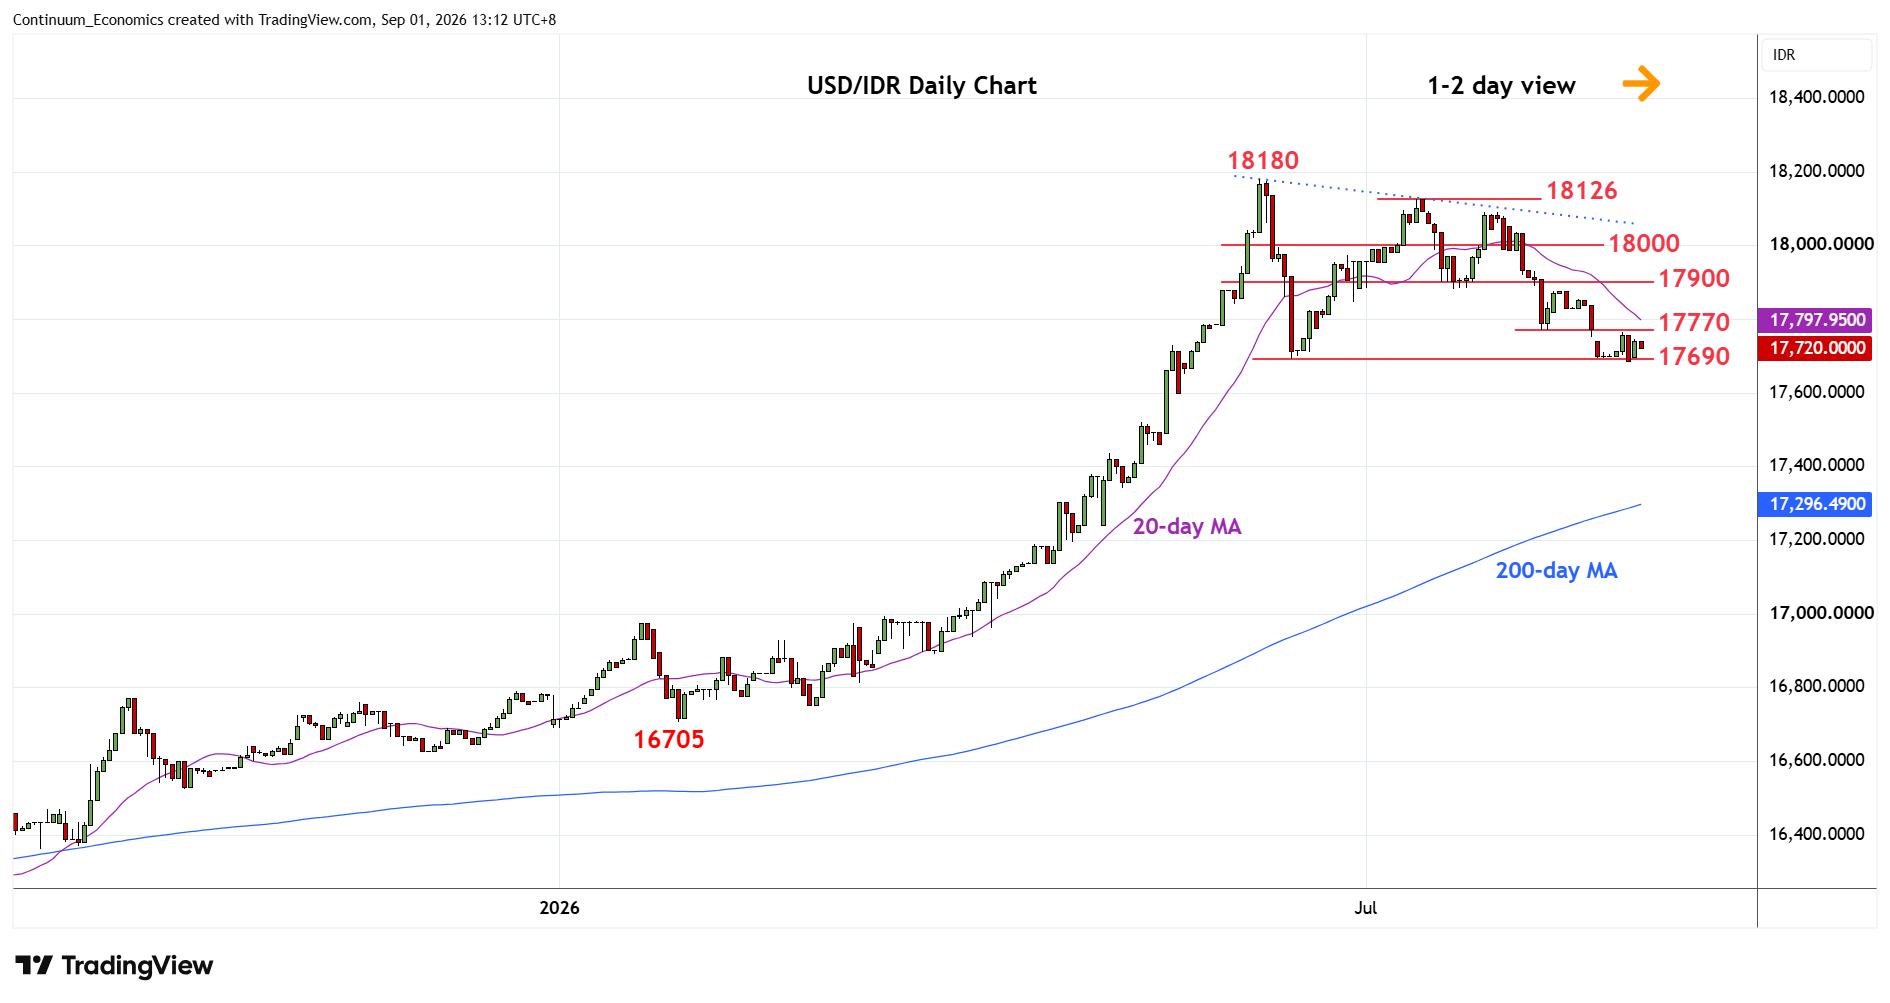
Chart USD/IDR Updates: Consolidation test of 17690/17685 lows
-
Little change, as prices extend consolidation above the 17690/17685 June and August lows and unwind oversold daily studies
| Levels | Imp | Comment | Levels | Imp | Comment | |||
|---|---|---|---|---|---|---|---|---|
| R4 | 18126 | ** | 13 Jun high | S1 | 17690 | ** | Jun low | |
| R3 | 18000 | * | congestion | S2 | 17600 | * | 20 May low | |
| R2 | 17880/900 | ** | Jul low, congestion | S3 | 17520 | * | 12 May high | |
| R1 | 17770 | * | 10 Aug low | S4 | 17385 | * | 38.2% 2025/2026 rally |
Asterisk denotes strength of level
05:15 GMT - Little change, as prices extend consolidation above the 17690/17685 June and August lows and unwind oversold daily studies. Consolidation see resistance starting at the 17770/17800 area where break is needed to open up room for stronger bounce to the 17880/17900 July lows turned resistance which is expected to cap. Corrective gains are expected to give way to renewed selling pressure later. Below 17690/17685 support will see room for deeper pullback to retrace gains from the August 2025 year low to support at the 17600/17520 area and 17385, 38.2% Fibonacci level.