Published: 2026-06-12T05:00:24.000Z
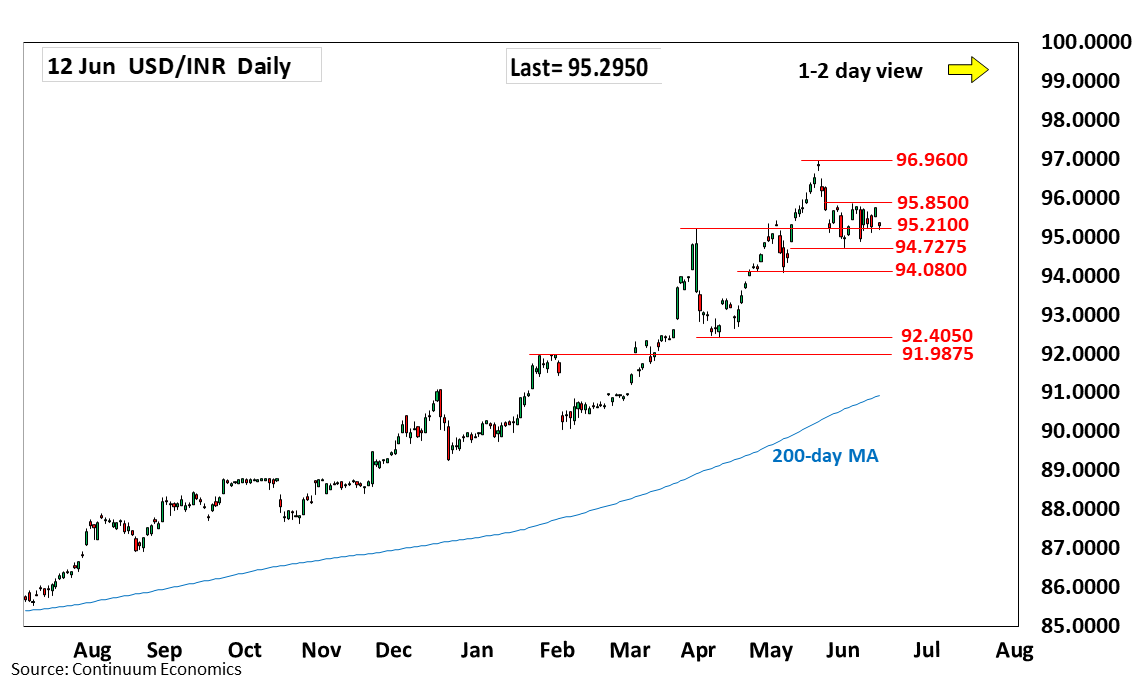
Chart USD/INR Update: Extend consolidation above 94.7275 low
-
Extending choppy trade following bounce from the 94.7275, 1 June low
| Level | Comment | Level | Comment | |||||
|---|---|---|---|---|---|---|---|---|
| R4 | 97.1000 | projection | S1 | 95.2100 | * | Mar high | ||
| R3 | 96.9600 | ** | 20 May all-time high | S2 | 94.7275 | ** | 1 Jun low | |
| R2 | 96.0000 | * | figure | S3 | 94.0800 | ** | May low | |
| R1 | 95.8500 | ** | 3 Jun high | S4 | 93.4100 | ** | 15 Apr high |
Asterisk denotes strength of level
04:50 GMT - Extending choppy trade following bounce from the 94.7275, 1 June low. The resulting flag pattern suggest consolidation giving way to renewed selling pressure later to extend losses from the 96.9600 May all-time high to retrace gains from the April low to strong support at the 94.0800/94.0000 area. Lower still, will see room to 93.4100 support and the 93.0000 figure. Meanwhile, resistance at the 95.7925/95.8500 highs are expected to cap. Break needed to clear the way for extension to retest the 96.0000 figure and the 96.9600 all-time high.