Published: 2026-05-22T04:59:35.000Z
Chart USD/INR Update: Weighing on 96.0000 level
2
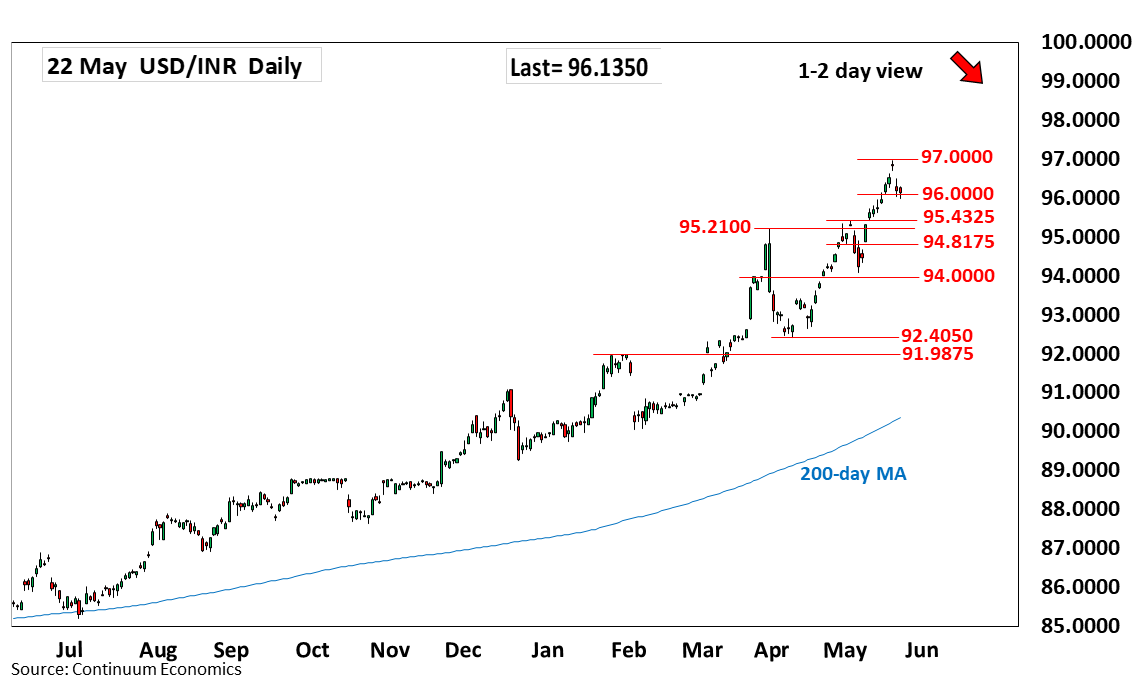
Under pressure as prices extend pullback from the 96.9600 historic high to weigh on the 96.0000 level
| Level | Comment | Level | Comment | |||||
|---|---|---|---|---|---|---|---|---|
| R4 | 98.0000 | figure, projection | S1 | 96.0000 | * | figure | ||
| R3 | 97.5000 | figure | S2 | 95.4325 | * | 5 May high | ||
| R2 | 97.1000 | projection | S3 | 95.2100 | ** | Mar high | ||
| R1 | 96.9600 | ** | 20 May all-time high | S4 | 94.8175 | * | 4 May low |
Asterisk denotes strength of level
04:50 GMT - Under pressure as prices extend pullback from the 96.9600 historic high to weigh on the 96.0000 level. Daily have turned down to unwind overbought readings and suggest scope for break here to open up room for deeper pullback to strong support at 95.4325 and 95.2100, the 5 May and March highs. Would take break here to fade the upside pressure and see room for deeper pullback to retrace gains from the April low. Meanwhile, resistance at the 96.9600 high is expected to cap. Break here and the 97.0000 figure, if seen, will open up room for to 97.1000/97.5000 projection targets.