Published: 2026-06-16T04:48:38.000Z
Chart USD/IDR Updates: Extending losses
2
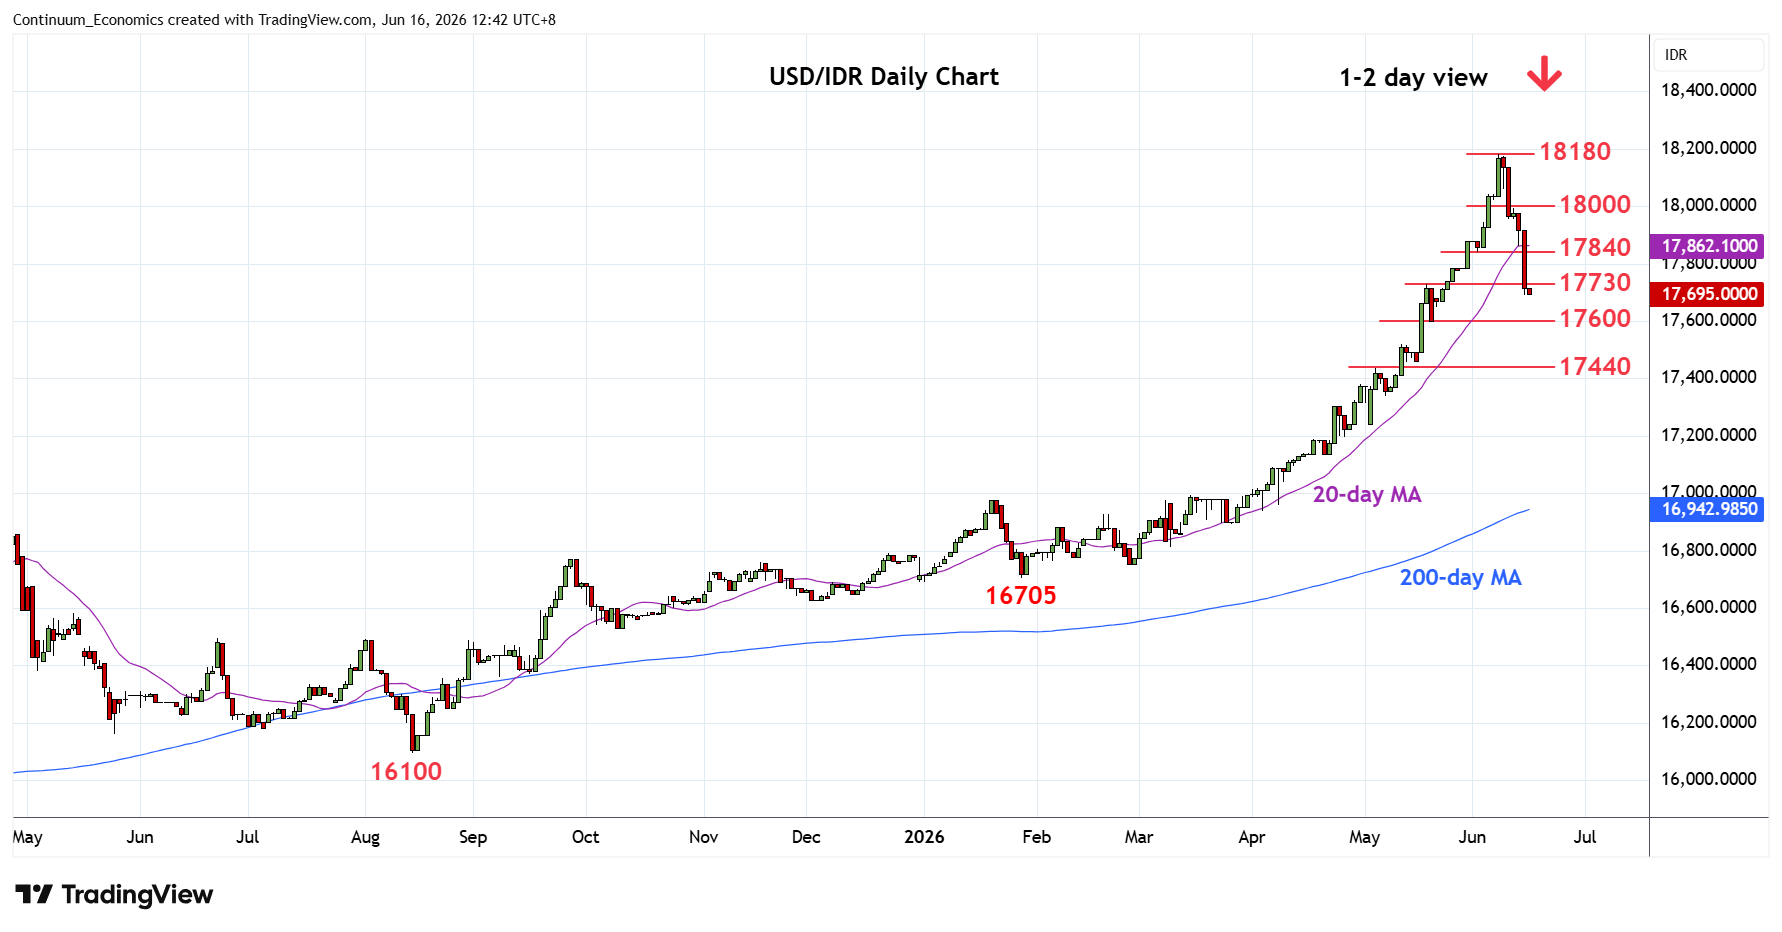
Extending pullback from the 18180 all-time high and break of the 17730 support has seen losses to 17690 low
| Levels | Imp | Comment | Levels | Imp | Comment | |||
|---|---|---|---|---|---|---|---|---|
| R4 | 18200 | projection | S1 | 17600 | * | 38.2% Jan/Jun rally | ||
| R3 | 18180 | ** | 8 Jun all-time high | S2 | 17520 | * | 12 May high | |
| R2 | 18000 | * | figure | S3 | 17440 | * | 5 May high, 50% | |
| R1 | 17840 | * | 2 Jun low | S4 | 17340 | * | 7 May low |
Asterisk denotes strength of level
04:45 GMT - Extending pullback from the 18180 all-time high and break of the 17730 support has seen losses to 17690 low. Prices are unwinding overbought daily and weekly studies and lower will see room to the support at the 17600 congestion and 38.2% Fibonacci level. Lower still, will further retrace parabolic gains from the 16705 January YTD low and see room to 17520/17500 congestion area and 17440, 50% Fibonacci level. Meanwhile, resistance is lowered to the 17800/17840 congestion area which is expected to cap and sustain losses from the 18180 high.