Published: 2026-10-22T02:48:24.000Z
Chart USD/MYR Update: Drifting at the 4.0800 level
1
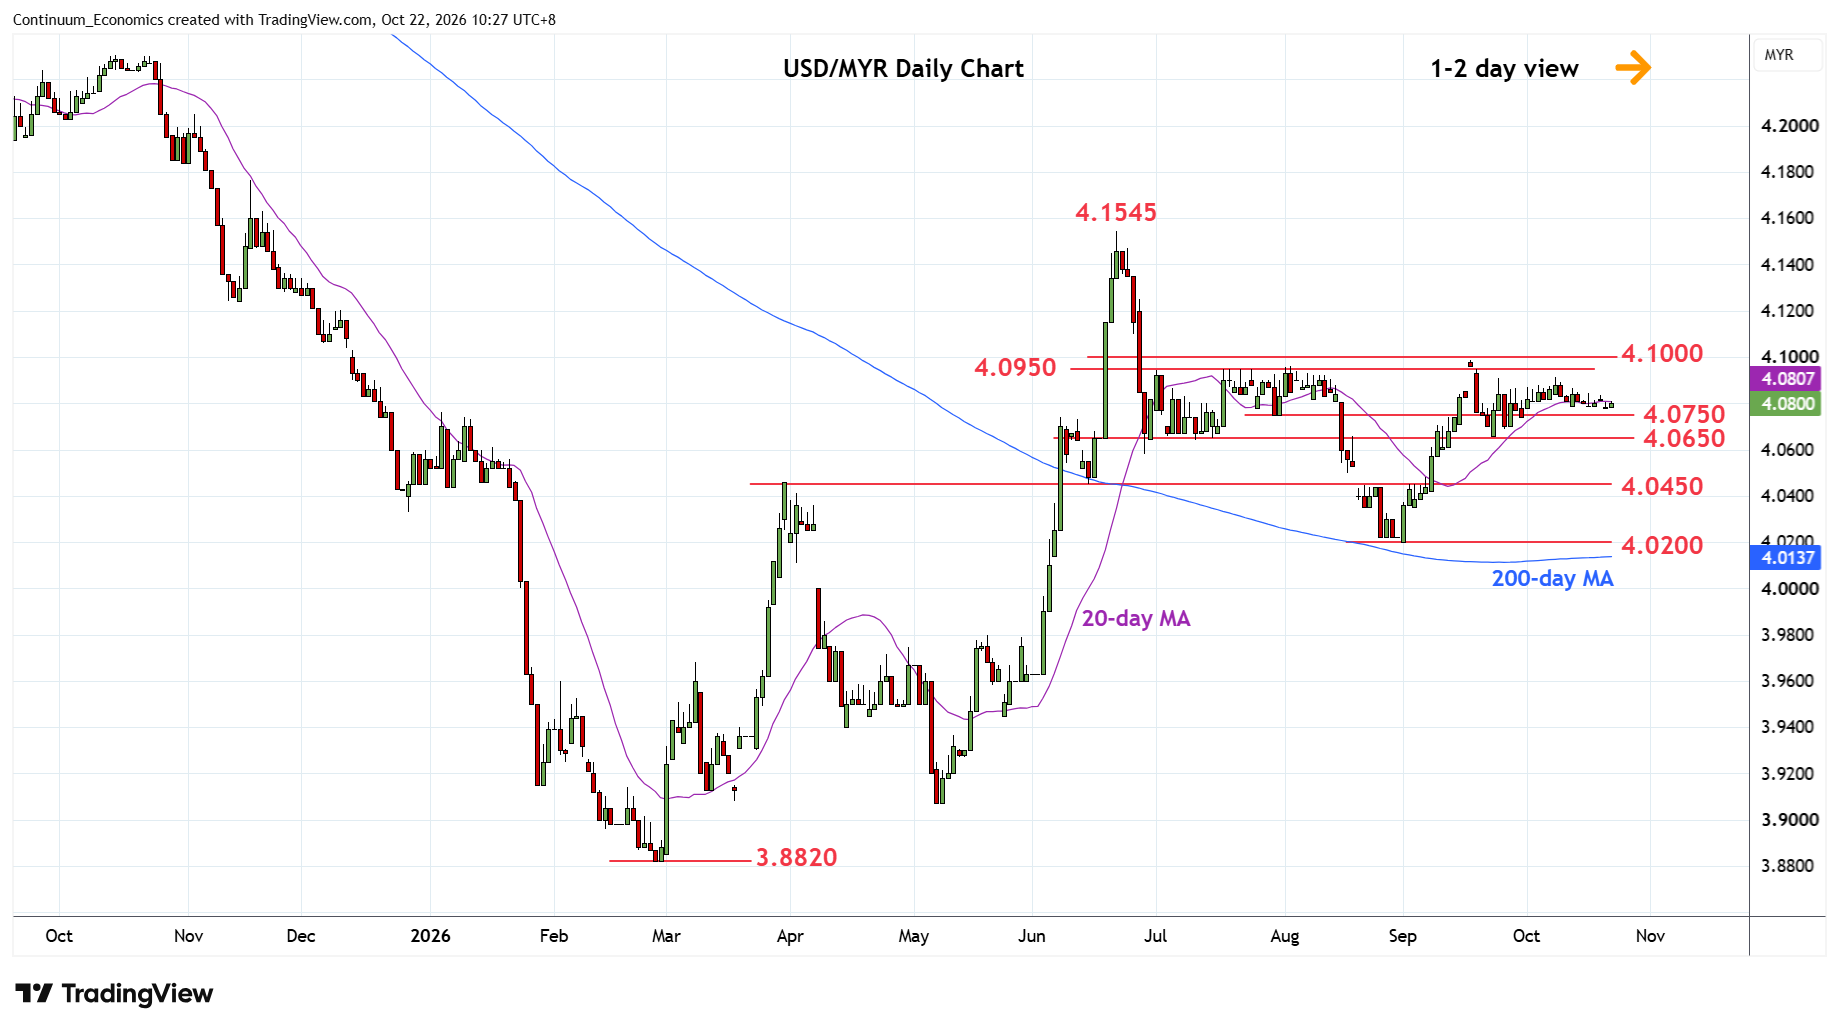
Little change, as prices drift narrowly to extend pullback from 4.0915 high of 8 October
| Levels | Imp | Comment | Levels | Imp | Comment | |||
|---|---|---|---|---|---|---|---|---|
| R4 | 4.1150 | * | congestion | S1 | 4.0750 | * | congestion | |
| R3 | 4.0985 | ** | Sep high | S2 | 4.0650 | ** | Jul low | |
| R2 | 4.0950 | ** | Jul high, congestion | S3 | 4.0600 | * | congestion | |
| R1 | 4.0915 | * | 8 Oct high | S4 | 4.0450 | ** | 2 Sep high |
Asterisk denotes strength of level
02:45 GMT - Little change, as prices drift narrowly to extend pullback from 4.0915 high of 8 October. Daily studies have turned mixed at oversold areas but downside bias from the latter see prices leaning towards support at the 4.0750 congestion. Would take break here to open up room for deeper pullback to the 4.0650/4.0600 area. Meanwhile, resistance remains at the 4.0915 high. Break here will open up room for retest of resistance at the 4.0950/4.0985, July/September highs. Above here will extend the broader gains from 4.0200 September low.