Published: 2026-10-15T02:36:08.000Z
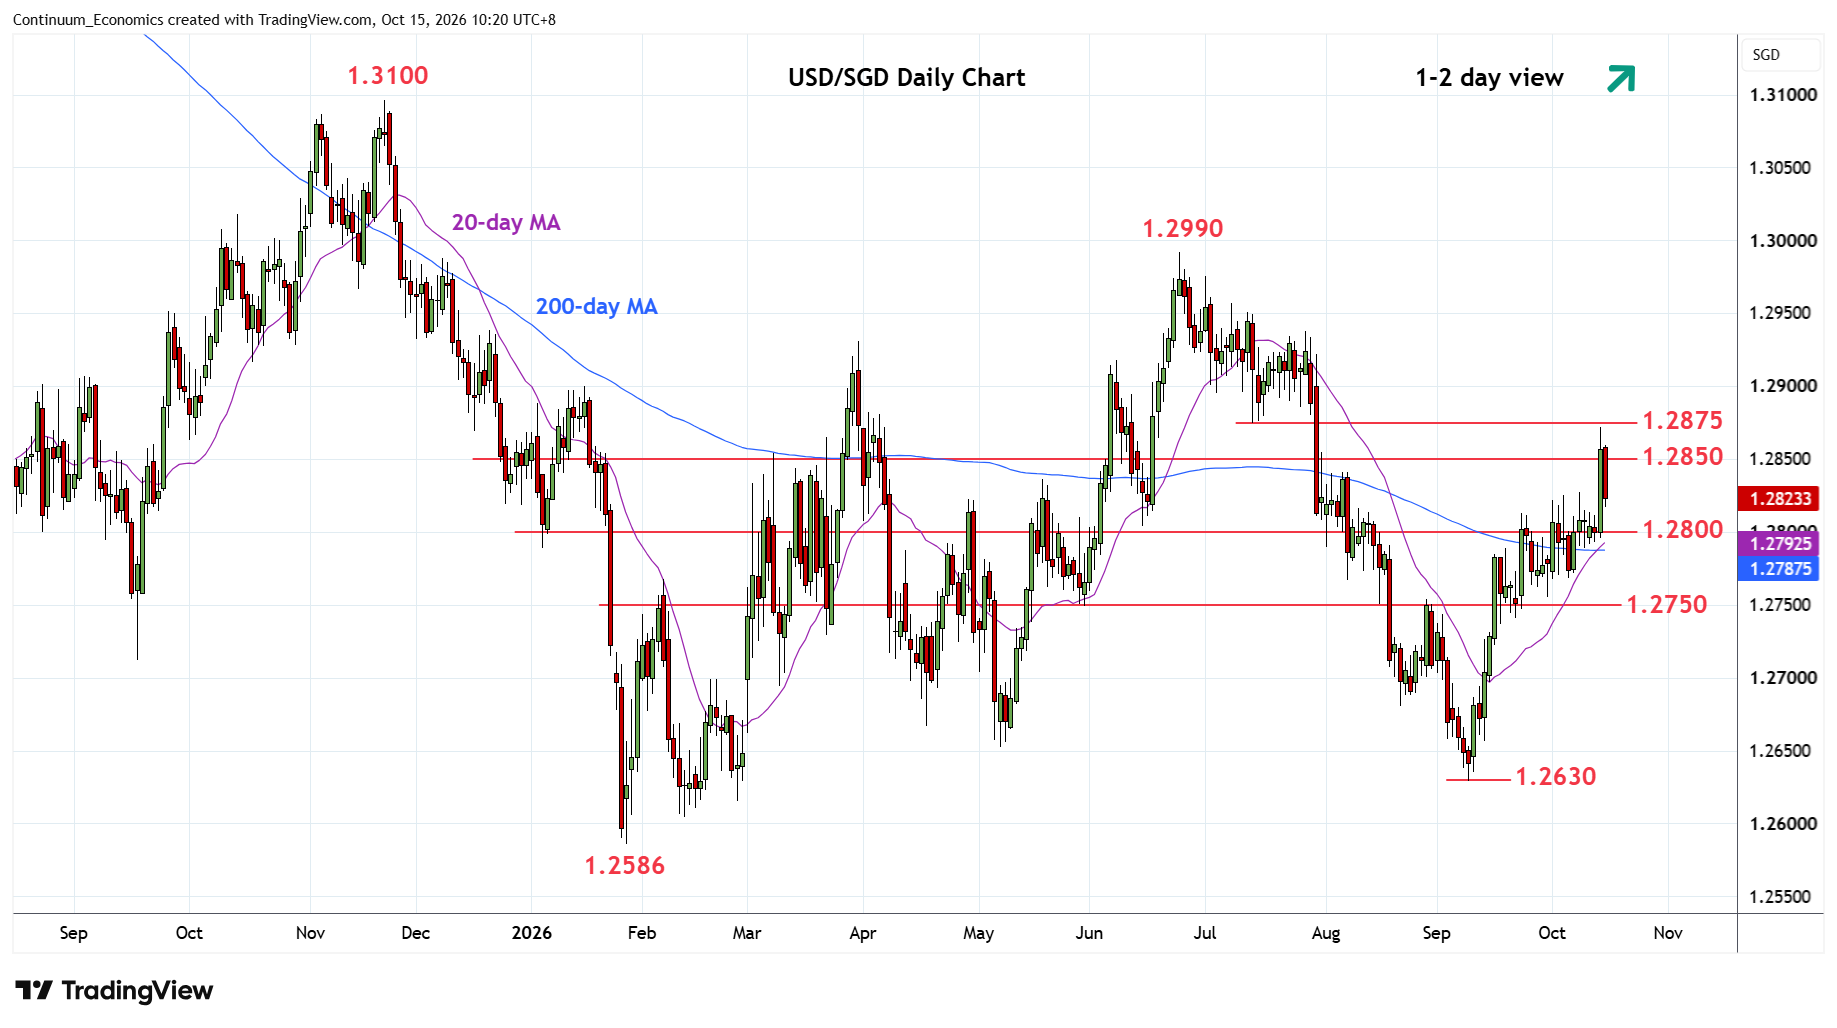
Chart USD/SGD Update: Bounce capped at 1.2875 resistance
1
Consolidation around the 1.2800 level has given way to push higher to approach strong resistance at the 1.2875 low of 14 July
| Level | Comment | Level | Comment | ||||
|---|---|---|---|---|---|---|---|
| R4 | 1.2950 | * | congestion | S1 | 1.2800 | * | congestion |
| R3 | 1.2930 | * | Mar high | S2 | 1.2750 | ** | congestion |
| R2 | 1.2900 | * | congestion | S3 | 1.2700 | * | congestion, Jul 2025 year low |
| R1 | 1.2875 | ** | 14 Jul low | S4 | 1.2680 | * | Aug low |
Asterisk denotes strength of level
02:25 GMT - Consolidation around the 1.2800 level has given way to push higher to approach strong resistance at the 1.2875 low of 14 July. Prices has since settled back from the 1.2872 high to unwind overbought intraday studies. Gains beyond this expected to be limited with divergence on daily studies suggesting scope for pullback to support at the 1.2800/1.2750 congestion area. Below here will return focus to the downsie for retest of 1.2700/1.2680 support. Meanwhile, resistance at the 1.2875/1.2900 area expected to cap.