Published: 2026-10-29T04:48:42.000Z
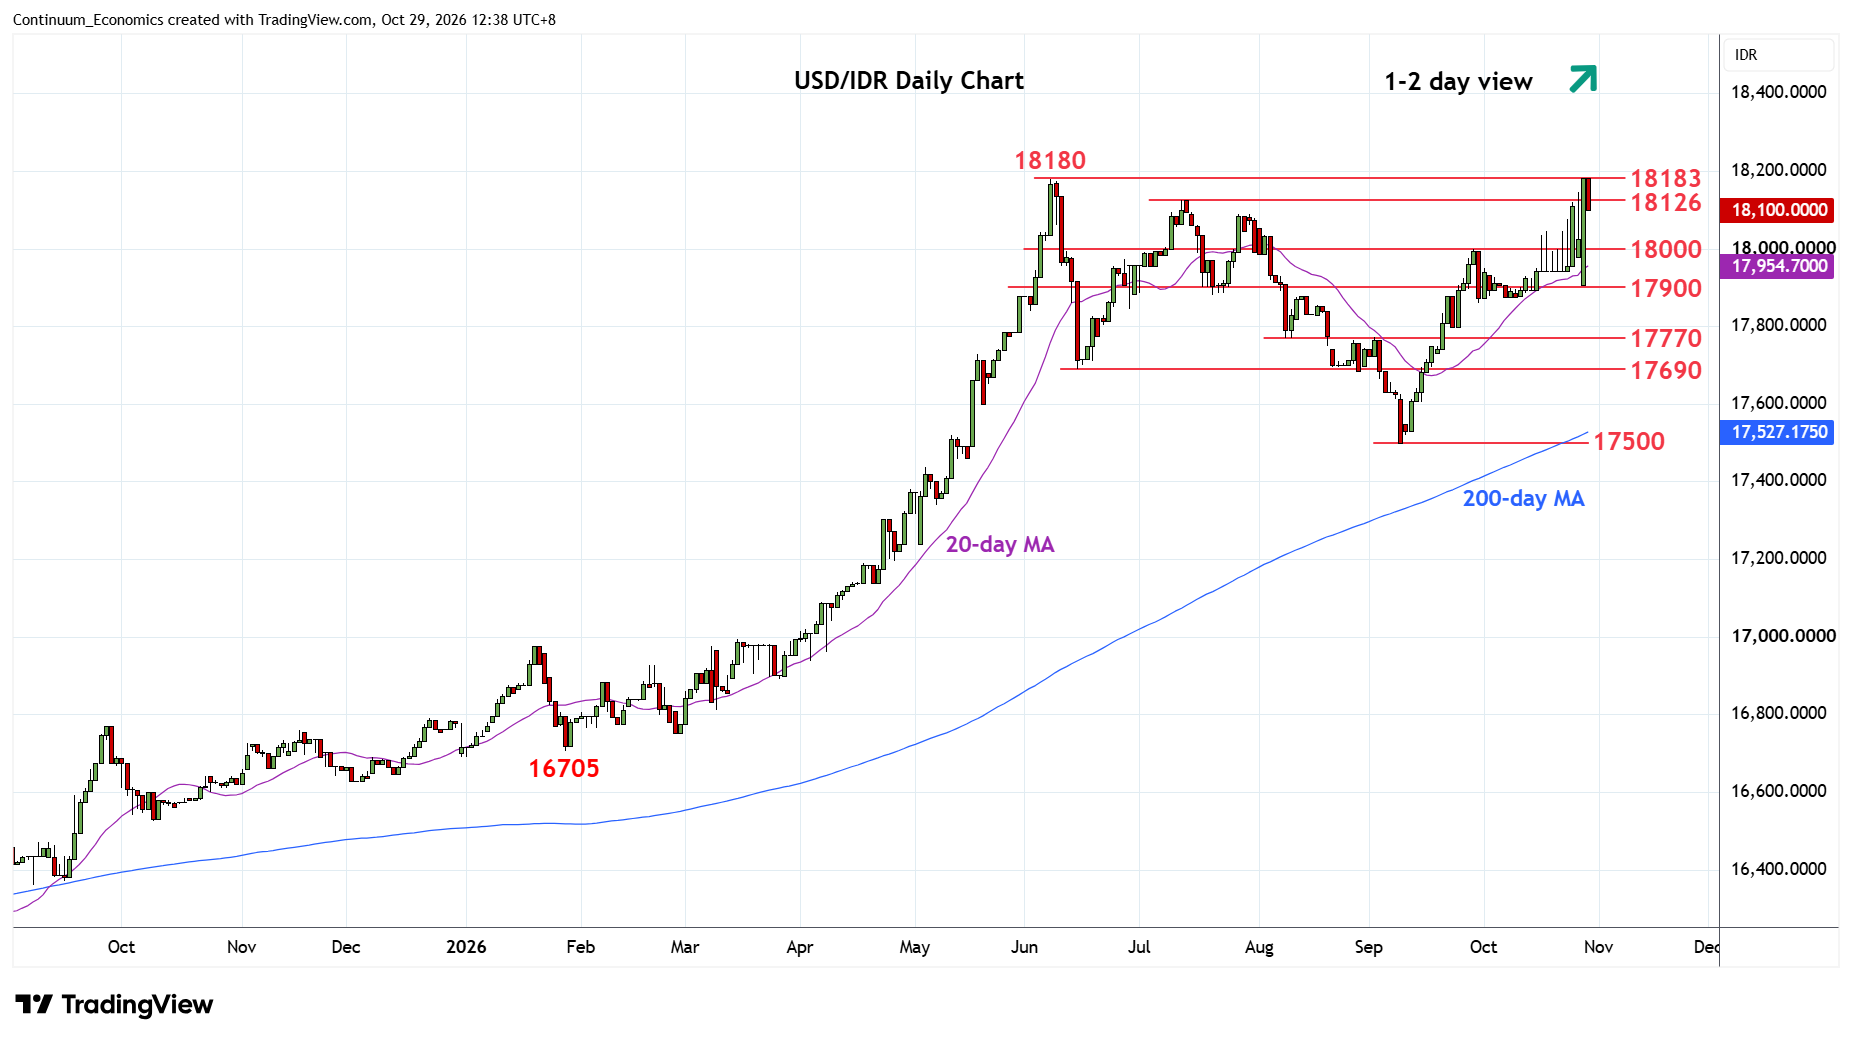
Chart USD/IDR Updates: Consolidating gains to fresh all-time high at 18183
2
Volatile trade saw gains to retest 18180 June high and marginal break to post fresh all-time high at 18183
| Levels | Imp | Comment | Levels | Imp | Comment | |||
|---|---|---|---|---|---|---|---|---|
| R4 | 18550 | projection | S1 | 18000 | ** | Sep high | ||
| R3 | 18500 | figure | S2 | 17900 | * | congestion | ||
| R2 | 18300 | projection | S3 | 17860 | * | 30 Sep low | ||
| R1 | 18183 | ** | 28 Oct all-time high | S4 | 17770 | * | 10 Aug low |
Asterisk denotes strength of level
04:45 GMT - Volatile trade saw gains to retest 18180 June high and marginal break to post fresh all-time high at 18183. Prices has since settled back to consolidate strong gains from the 17500 September low but bullish prices action from the latter suggest scope for break here to extend the underlying bull trend. Break, if seen, will see room to 18300 projection target. Meanwhile, support is raised to the 18000 figure and September high which should now underpin. Failure here will ease the upside pressure and see room for deeper pullback to the 17900/17860 support.