Published: 2026-06-04T02:52:54.000Z
Chart USD/THB Update: Consolidating test of 32.80/85 resistance
1
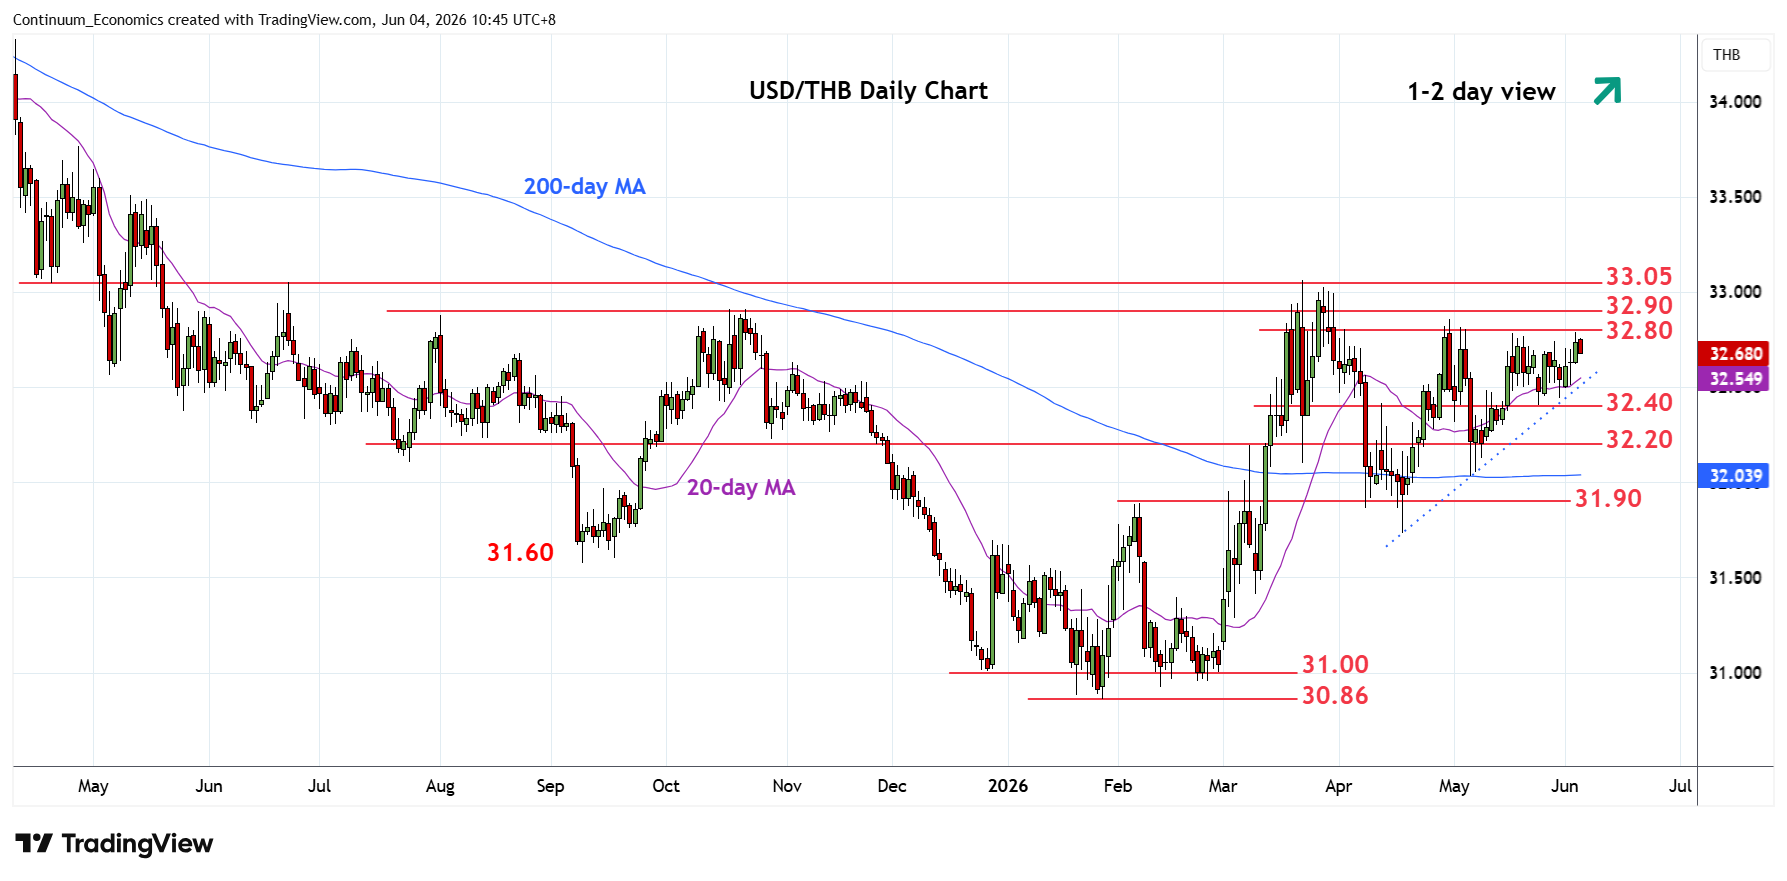
Little change, as prices consolidate test of resistance at the 32.80/85 area
| Level | Comment | Level | Comment | |||||
|---|---|---|---|---|---|---|---|---|
| R4 | 33.20 | * | congestion | S1 | 32.50/40 | ** | congestion | |
| R3 | 33.05 | ** | 23 Mar YTD high | S2 | 32.20 | * | congestion | |
| R2 | 32.90 | * | Oct high | S3 | 32.03 | ** | 6 May low | |
| R1 | 32.80/85 | ** | congestion, 30 Apr high | S4 | 31.90 | * | Feb high |
Asterisk denotes strength of level
03:15 GMT - Little change, as prices consolidate test of resistance at the 32.80/85 area. However, the resulting ascending triangle suggest scope for break here to open up room for retest of strong resistance at 32.90 October high then the 33.05 March current year high. Above the latter will confirm a 9-month bottom pattern at the January YTD low and see stronger gains to retrace losses from the 2023/2024 year highs. Meanwhile, support at 32.50/40 congestion should underpin. Would take break here to fade the upside pressure and open up room for deeper pullback to the 32.20 support and 32.03, May low.