Published: 2026-06-22T03:07:16.000Z
Chart USD/THB Update: Consolidating retest of 33.00/05 highs
-
Break above the 32.80/32.90 resistance has seen gains to retest the 33.00 level
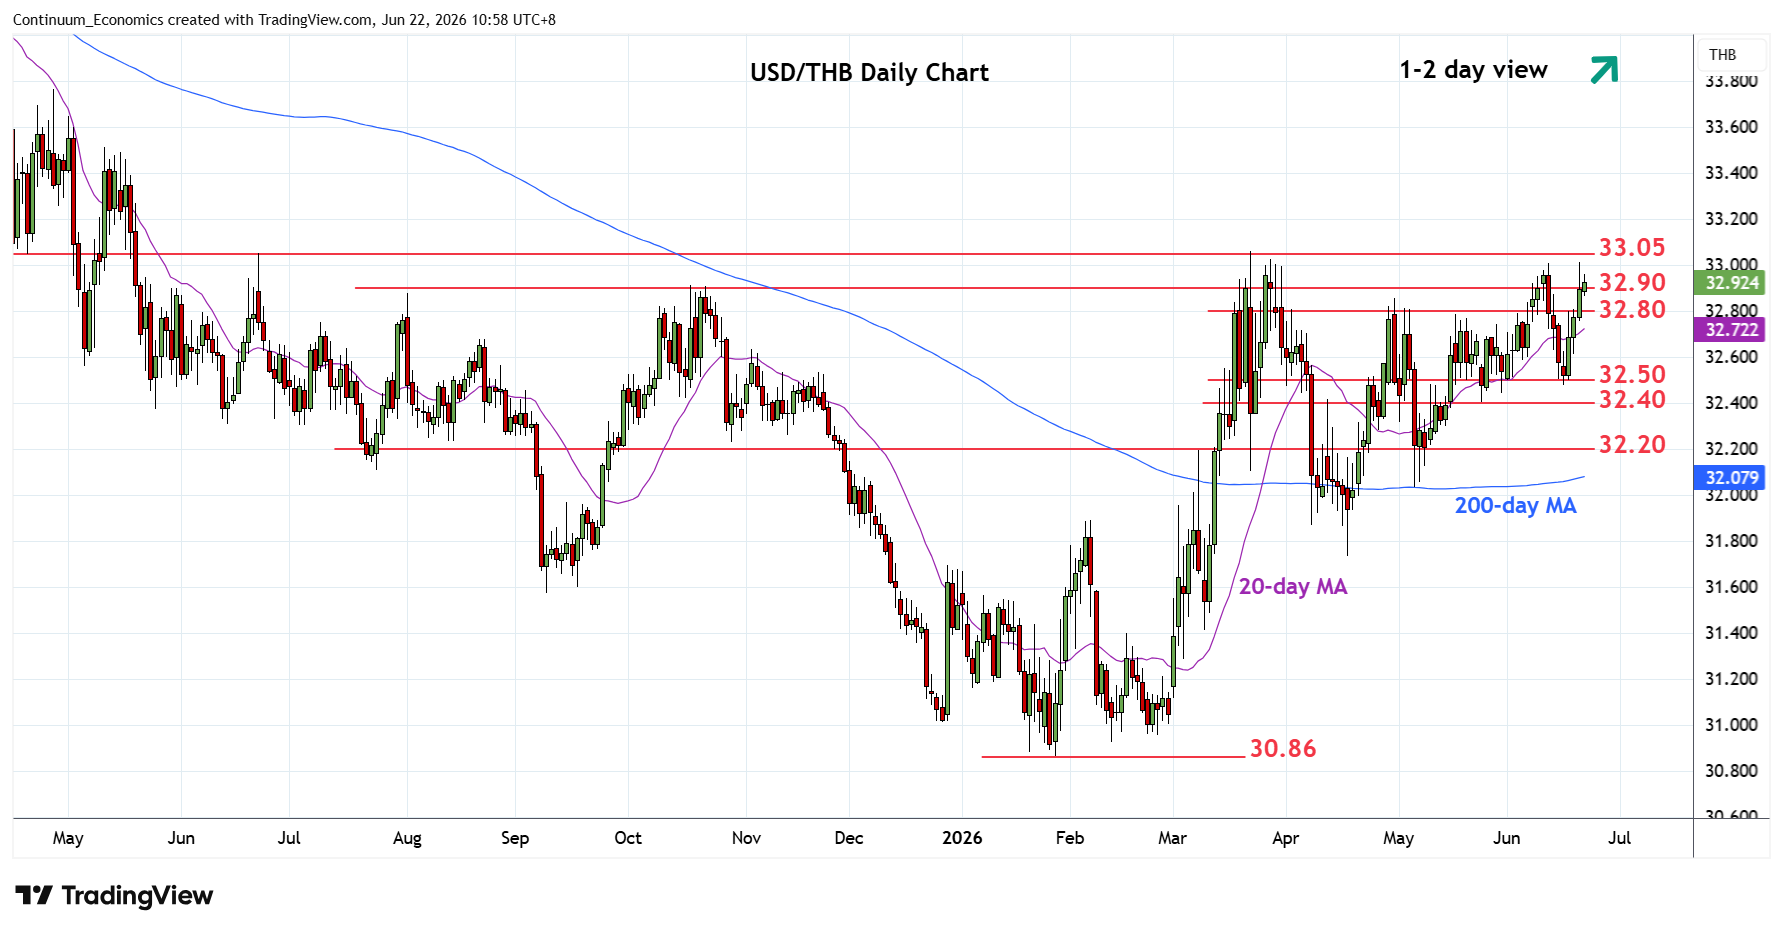
| Level | Comment | Level | Comment | |||||
|---|---|---|---|---|---|---|---|---|
| R4 | 33.42 | * | 61.8% 2025/Jan fall | S1 | 32.80 | * | congestion | |
| R3 | 33.20 | * | congestion | S2 | 32.50 | ** | 16 Jun low, congestion | |
| R2 | 33.05 | ** | 23 Mar YTD high | S3 | 32.40 | * | 25 May low | |
| R1 | 33.00 | * | congestion | S4 | 32.20 | * | congestion |
Asterisk denotes strength of level
03:05 GMT - Break above the 32.80/32.90 resistance has seen gains to retest the 33.00 level. Consolidation here see room for extension to retest the March current year high at 33.05. Positive daily studies highlight scope for break here to confirm a broad 12-month bottom pattern at the January low and further retrace losses from the April 2025 year high. Break will see room for extension to the 33.20/40 congestion and 61.8% Fibonacci level. Meanwhile, support is raised to the 32.80 congestion. Below this will ease the upside pressure and see room for consolidation back to the 32.60/50 support.