Published: 2026-07-08T04:45:38.000Z
Chart USD/IDR Updates: Pressuring 18000 level
3
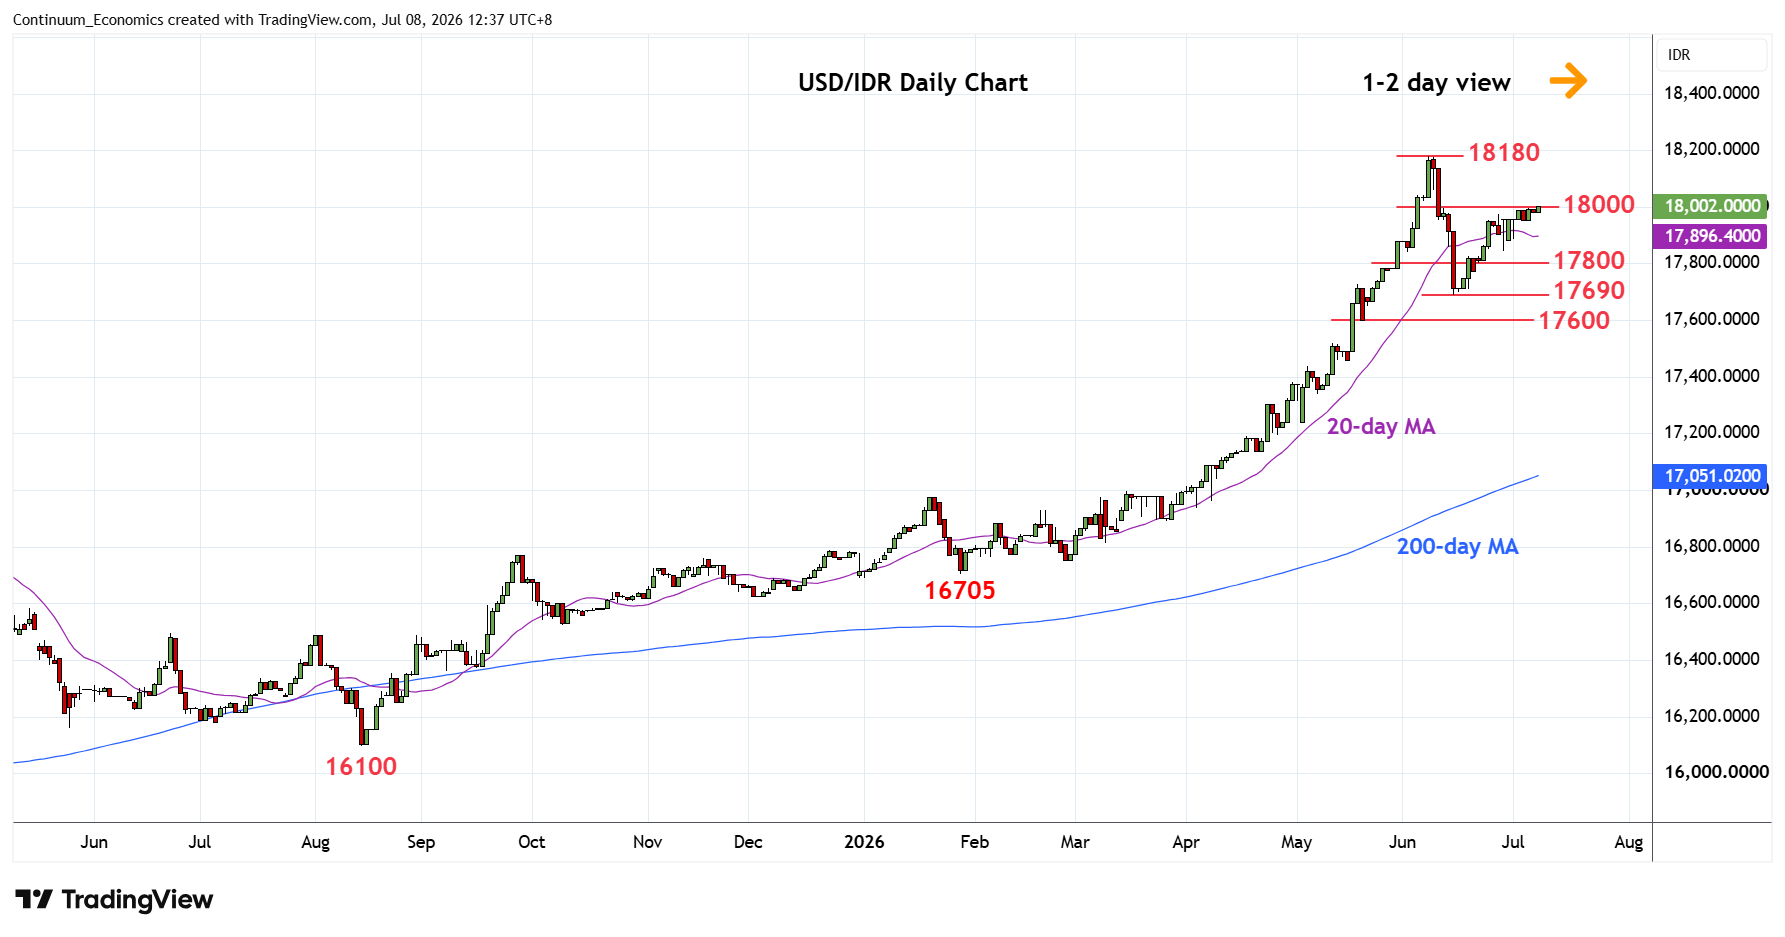
Still pressuring the upside as prices extend gains from the 17690 June low to reach the 18000 level
| Levels | Imp | Comment | Levels | Imp | Comment | |||
|---|---|---|---|---|---|---|---|---|
| R4 | 18470 | projection | S1 | 17800 | * | congestion | ||
| R3 | 18200 | congestion | S2 | 17690 | ** | 15 Jun low | ||
| R2 | 18180 | ** | 8 Jun all-time high | S3 | 17600 | * | 38.2% Jan/Jun rally | |
| R1 | 18000 | * | congestion | S4 | 17520 | * | 12 May high |
Asterisk denotes strength of level
04:40 GMT - Still pressuring the upside as prices extend gains from the 17690 June low to reach the 18000 level. Break here cannot be ruled out but overbought daily suggest gains giving way to selling pressure below the 18180 all-time high. Meanwhile, support is raised to the 17845/17800 area and see break here needed to return focus to the downside for retest of the 17690 June low. Break here will see room for deeper pullback to retrace gains from the 16705 January low and see scope to support at 17600, 38.2% Fibonacci retracement.