Published: 2026-07-07T15:53:23.000Z
Chart USD/BRL Update: Back in range
3
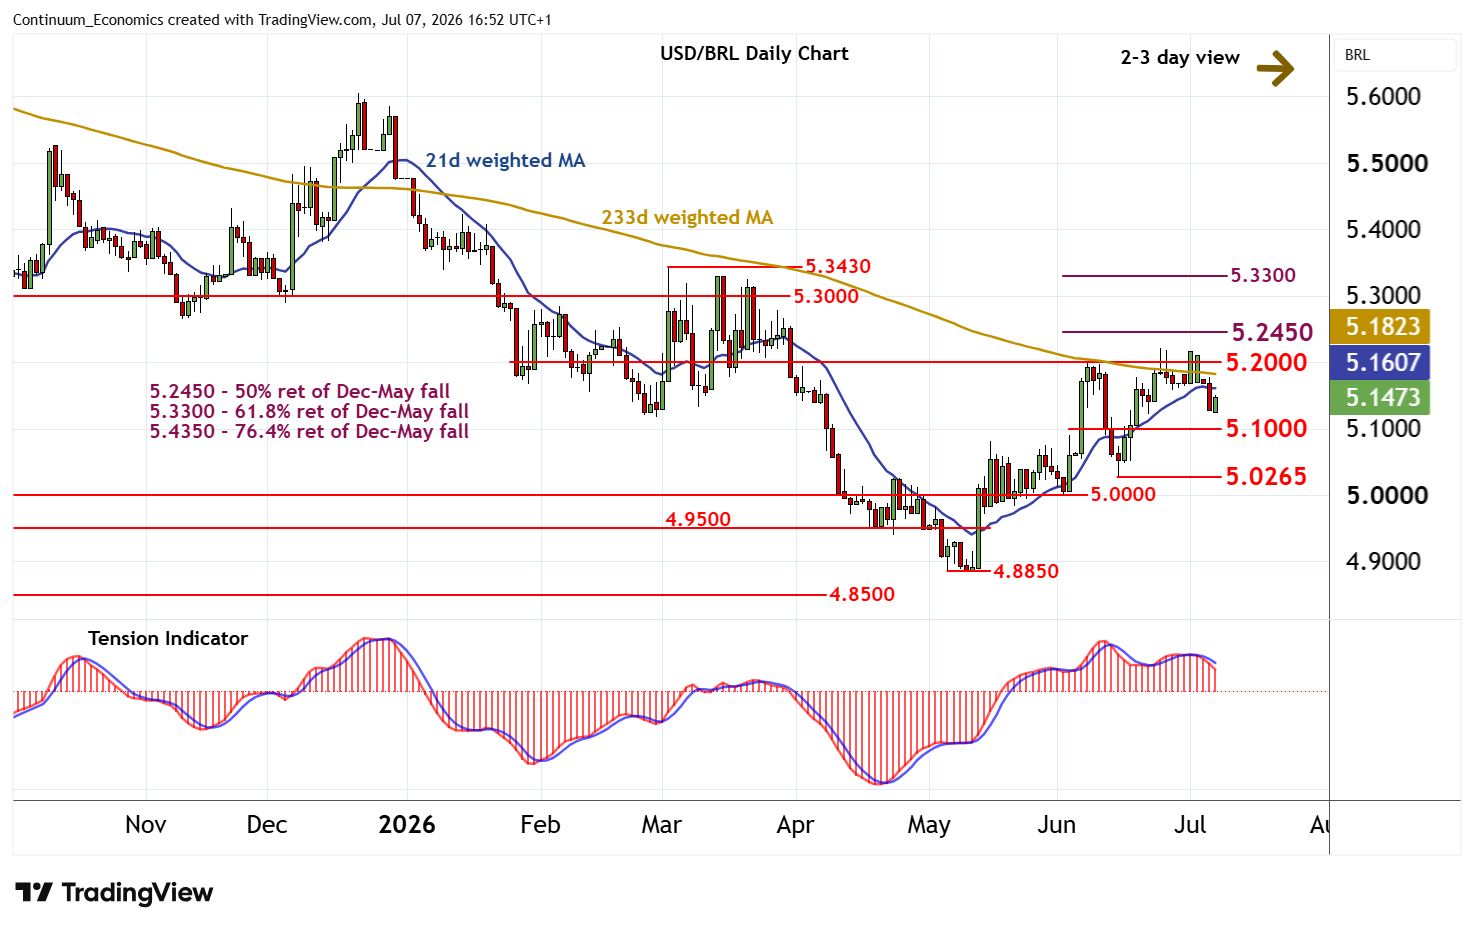
The anticipated test of congestion resistance at 5.2000 has not been sustained
| Levels | Imp | Comment | Levels | Imp | Comment | |||
|---|---|---|---|---|---|---|---|---|
| R4 | 5.3300 | ** | 61.8% ret of Dec-May fall | S1 | 5.1000 | * | break level | |
| R3 | 5.3000 | * | congestion | S2 | 5.0265 | * | 15 Jun (w) low | |
| R2 | 5.2450 | ** | 50% ret of Dec-May fall | S3 | 5.0000 | ** | congestion | |
| R1 | 5.2000 | ** | congestion | S4 | 4.9500 | ** | congestion |
Asterisk denotes strength of level
16:45 BST - The anticipated test of congestion resistance at 5.2000 has not been sustained, as overbought daily stochastics unwind, with prices settling lower into consolidation around 5.1500. The daily Tension Indicator is also falling, highlighting room for a test of support at 5.1000. But positive weekly charts should limit any break in renewed buying interest/consolidation above the 5.0265 weekly low of 15 June. Meanwhile, resistance remains at 5.2000. A close above here is needed to improve sentiment and prompt continuation of May gains towards the 5.2450 Fibonacci retracement.