Published: 2026-07-20T11:26:41.000Z
Chart EUR/CAD Update: Pressuring 1.6000/20 - studies under pressure
4
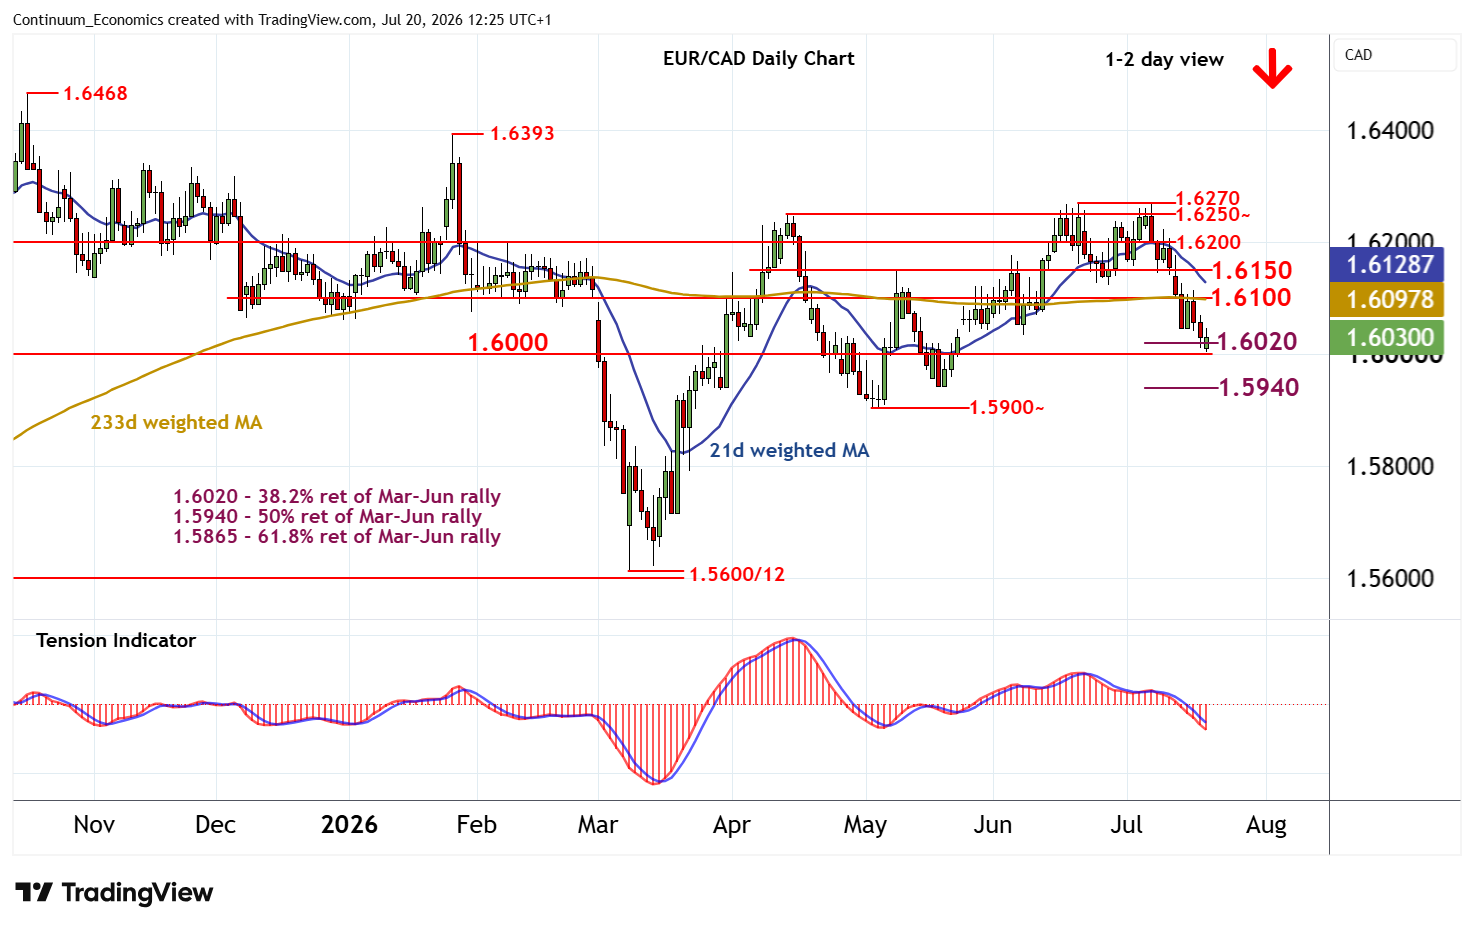
Steady selling interest has reached support within congestion around 1.6000 and the 1.6020 Fibonacci retracement
| Level | Comment | Level | Comment | |||||
|---|---|---|---|---|---|---|---|---|
| R4 | 1.6250~ | ** | 14 Apr (m) high | S1 | 1.6020 | * | 38.2% ret of Mar-Jun rally | |
| R3 | 1.6200 | ** | congestion | S2 | 1.6000 | ** | congestion | |
| R2 | 1.6150 | * | break level | S3 | 1.5940 | ** | 50% ret of Mar-Jun rally | |
| R1 | 1.6100 | ** | break level | S4 | 1.5900~ | ** | 4 May (m) low |
Asterisk denotes strength
12:20 BST - Steady selling interest has reached support within congestion around 1.6000 and the 1.6020 Fibonacci retracement, where unwinding oversold intraday studies are prompting short-term consolidation. Daily readings have ticked lower and broader weekly charts are falling, highlighting room for further losses in the coming sessions. A close beneath here will add weight to sentiment and extend late-June losses towards the 1.5940 retracement. Meanwhile, resistance is up to 1.6100. A close above here, if seen, will help to stabilise price action and prompt consolidation beneath 1.6150.