Published: 2026-08-20T05:07:42.000Z
Chart USD/IDR Updates: Extending losses
4
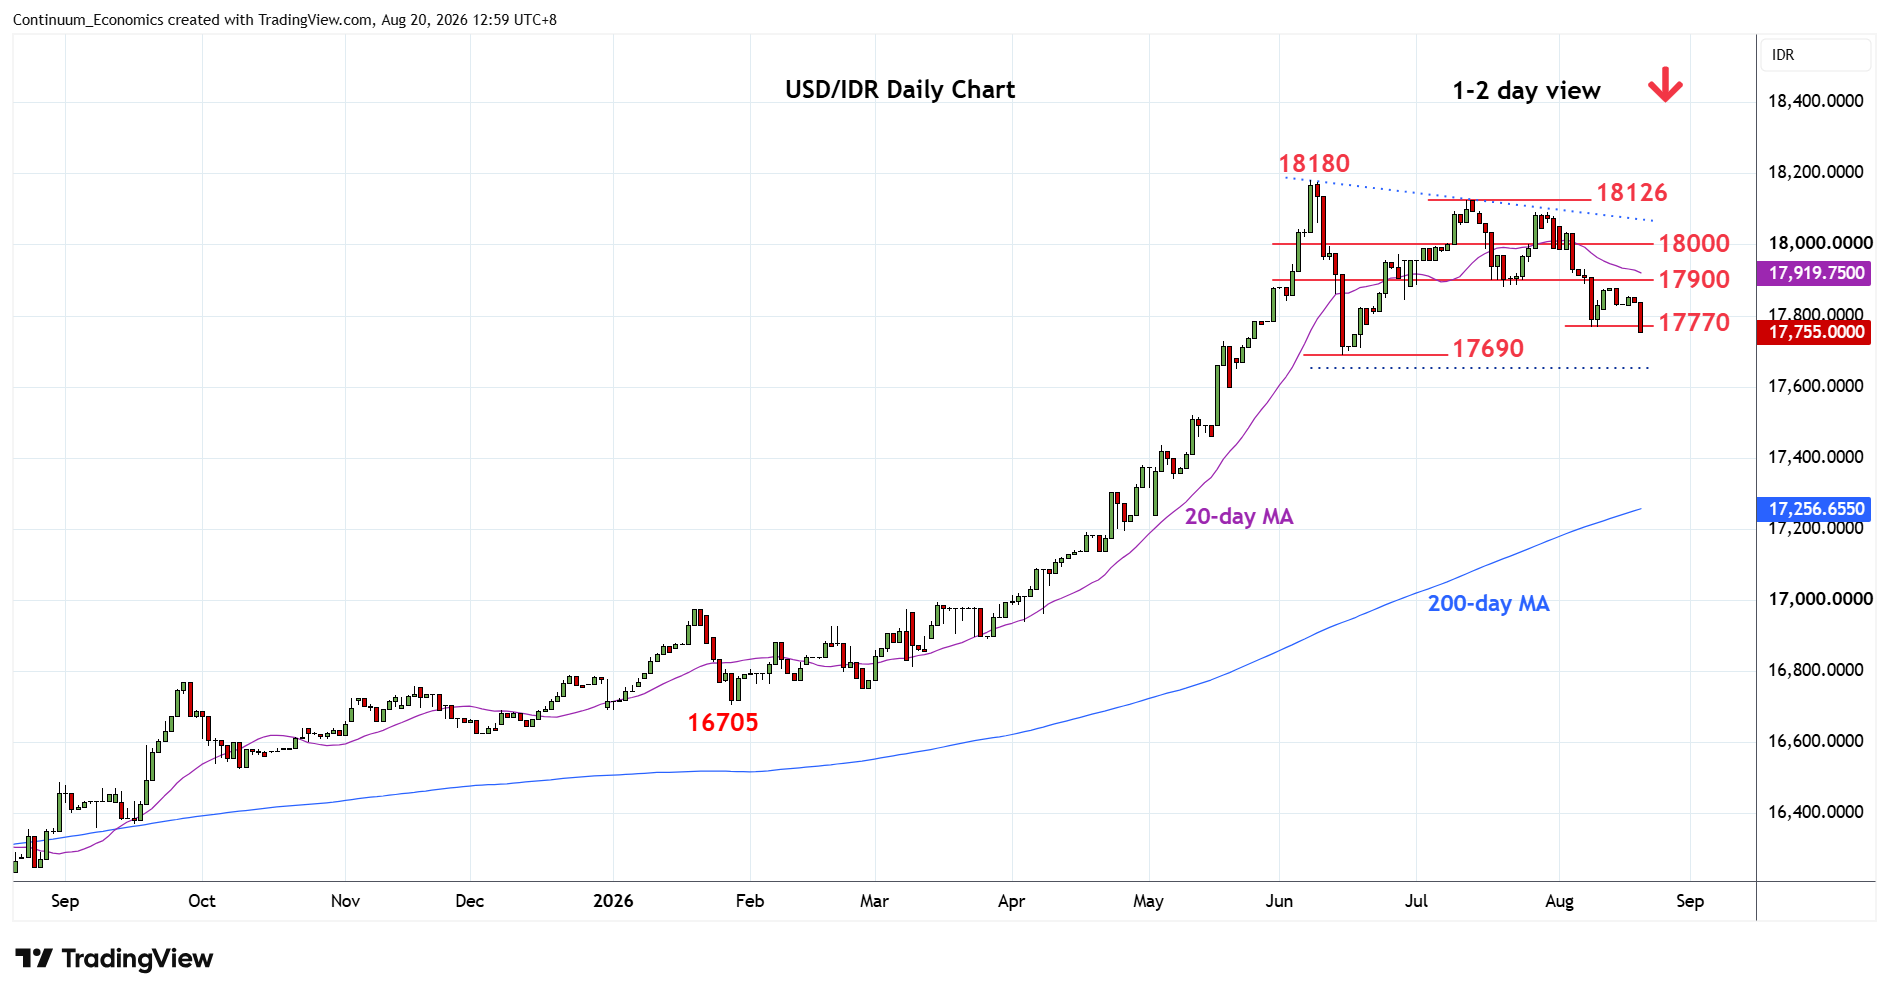
Consolidation around 17850 has given way to losses through the 17770 low of last week to extend the broader losses from the 18126, July high
| Levels | Imp | Comment | Levels | Imp | Comment | |||
|---|---|---|---|---|---|---|---|---|
| R4 | 18126 | ** | 13 Jun high | S1 | 17690 | ** | Jun low | |
| R3 | 18090 | ** | 28 Jul high | S2 | 17600 | * | 20 May low | |
| R2 | 18000 | * | congestion | S3 | 17520 | * | 12 May high | |
| R1 | 17880/900 | ** | Jul low, congestion | S4 | 17385 | * | 38.2% 2025/2026 rally |
Asterisk denotes strength of level
05:10 GMT - Consolidation around 17850 has given way to losses through the 17770 low of last week to extend the broader losses from the 18126, July high. Break shift focus to the 17690 June low with negative daily and weekly studies suggesting scope for break here to extend losses from the 18180 June current year high. Lower will see room to support at the 17600/17520 and 17385, 382.% Fibonacci level. Meanwhile, resistance at the 17880/17900 area now expected to cap corrective bounce and sustain losses from the July high.