Published: 2026-10-12T04:52:09.000Z
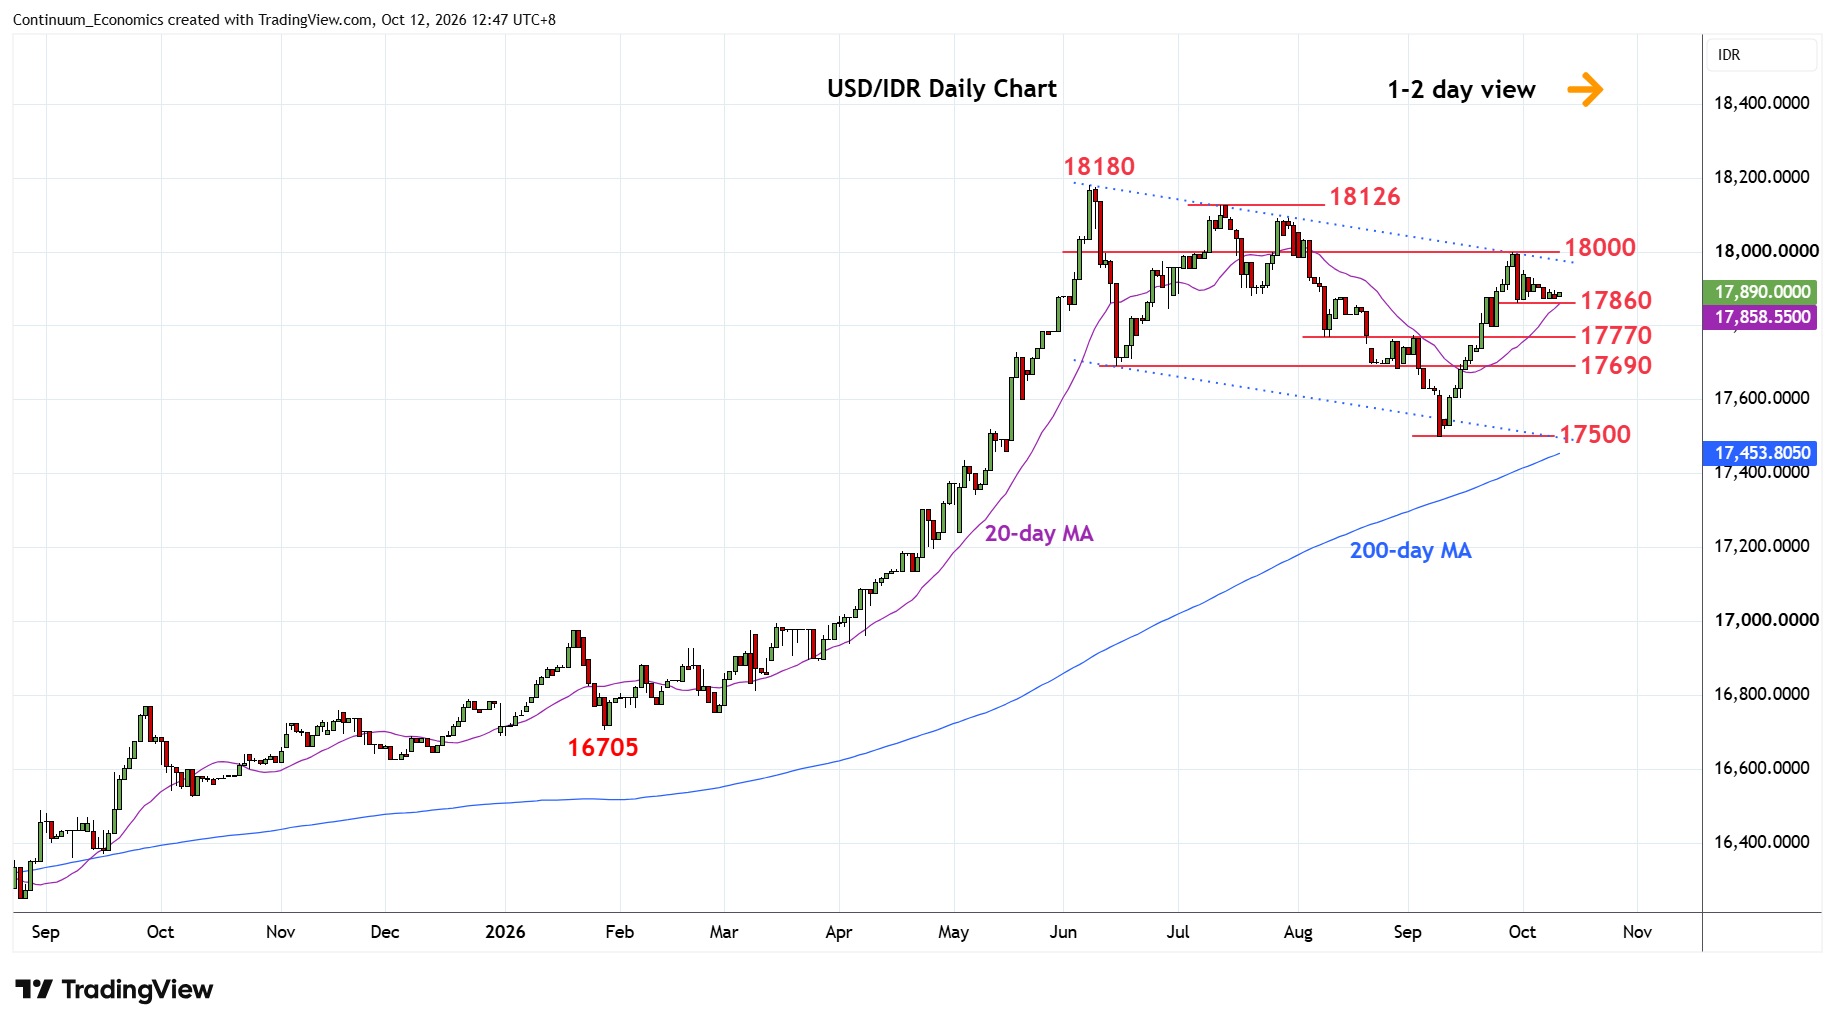
Chart USD/IDR Updates: Extend consolidation at 17880/17860 support
2
Little change, as prices drift narrowly above the 17880/17860 support
| Levels | Imp | Comment | Levels | Imp | Comment | |||
|---|---|---|---|---|---|---|---|---|
| R4 | 18180 | ** | 8 Jun YTD high | S1 | 17860 | * | 30 Sep low | |
| R3 | 18126 | ** | 13 Jul high | S2 | 17770 | * | 10 Aug low | |
| R2 | 18090 | * | 28 Jul high | S3 | 17690 | ** | Jun low | |
| R1 | 18000 | ** | figure | S4 | 17600 | * | congesion |
Asterisk denotes strength of level
04:00 GMT - Little change, as prices drift narrowly above the 17880/17860 support with the resulting flag pattern from the 18000 high keeping pressure on the downside. Scope is seen for break lower to retrace strong gains from the 17500 September low. Lower will see room to support at the 17800/17770 area. Below here will return focus to strong support at 17690, June low. Break of the latter will return focus to the 17500 September low and threatens break to extend losses from the June hgh. Meanwhile, resistance at the 18000 figure is expected to cap.