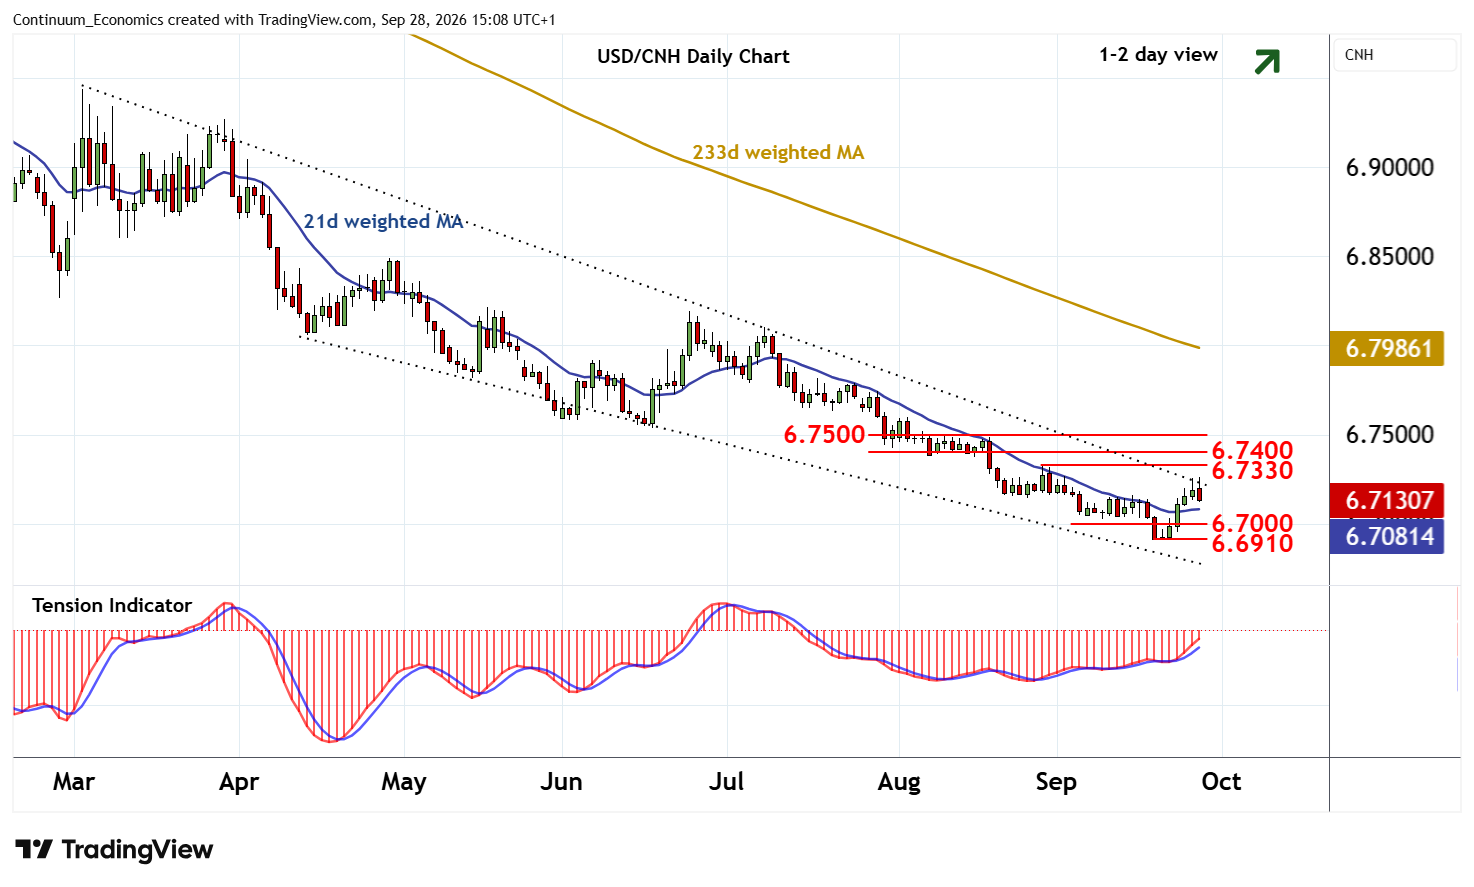
Chart USD/CNH Update: Limited pullback - studies continue to improve
The retest of the wedge top from March is giving way to a pullback
| Level | Imp | Comment | Level | Imp | Comment | |||
|---|---|---|---|---|---|---|---|---|
| R4 | 6.7540 | ** | Jun low | S1 | 6.7000 | * | congestion | |
| R3 | 6.7500 | ** | range highs, break level | S2 | 6.6910 | ** | 21 Sep YTD low | |
| R2 | 6.7400 | * | 7 Aug low, congestion | S3 | 6.6700 | ** | 2023 year low | |
| R1 | 6.7330 | * | 28 Aug (w) high | S4 | 6.6500 | * | congestion |
Asterisk denotes strength of level
15:05 BST - The retest of the wedge top from March is giving way to a pullback, as intraday studies turn down, with immediate focus on 6.7100. Overbought daily stochastics are also turning down, suggesting room for a break towards congestion support around 6.7000. However, the positive daily Tension Indicator and improving weekly charts should limit any tests in renewed buying interest/consolidation. A close below critical support at the 6.6910 current year low, if seen, will turn sentiment negative and extend broad losses towards the 6.6700 low of 2023.
Following cautious/corrective trade, further gains are looked for. Resistance is at the 6.7330 weekly high of 28 August. A break will open up congestion within the 6.7400 - 6.7500 range, where already overbought daily stochastics could prompt profit-taking/consolidation.