Published: 2026-07-07T06:02:48.000Z
Chart USD/MYR Update: Extend consolidation above 4.0600
1
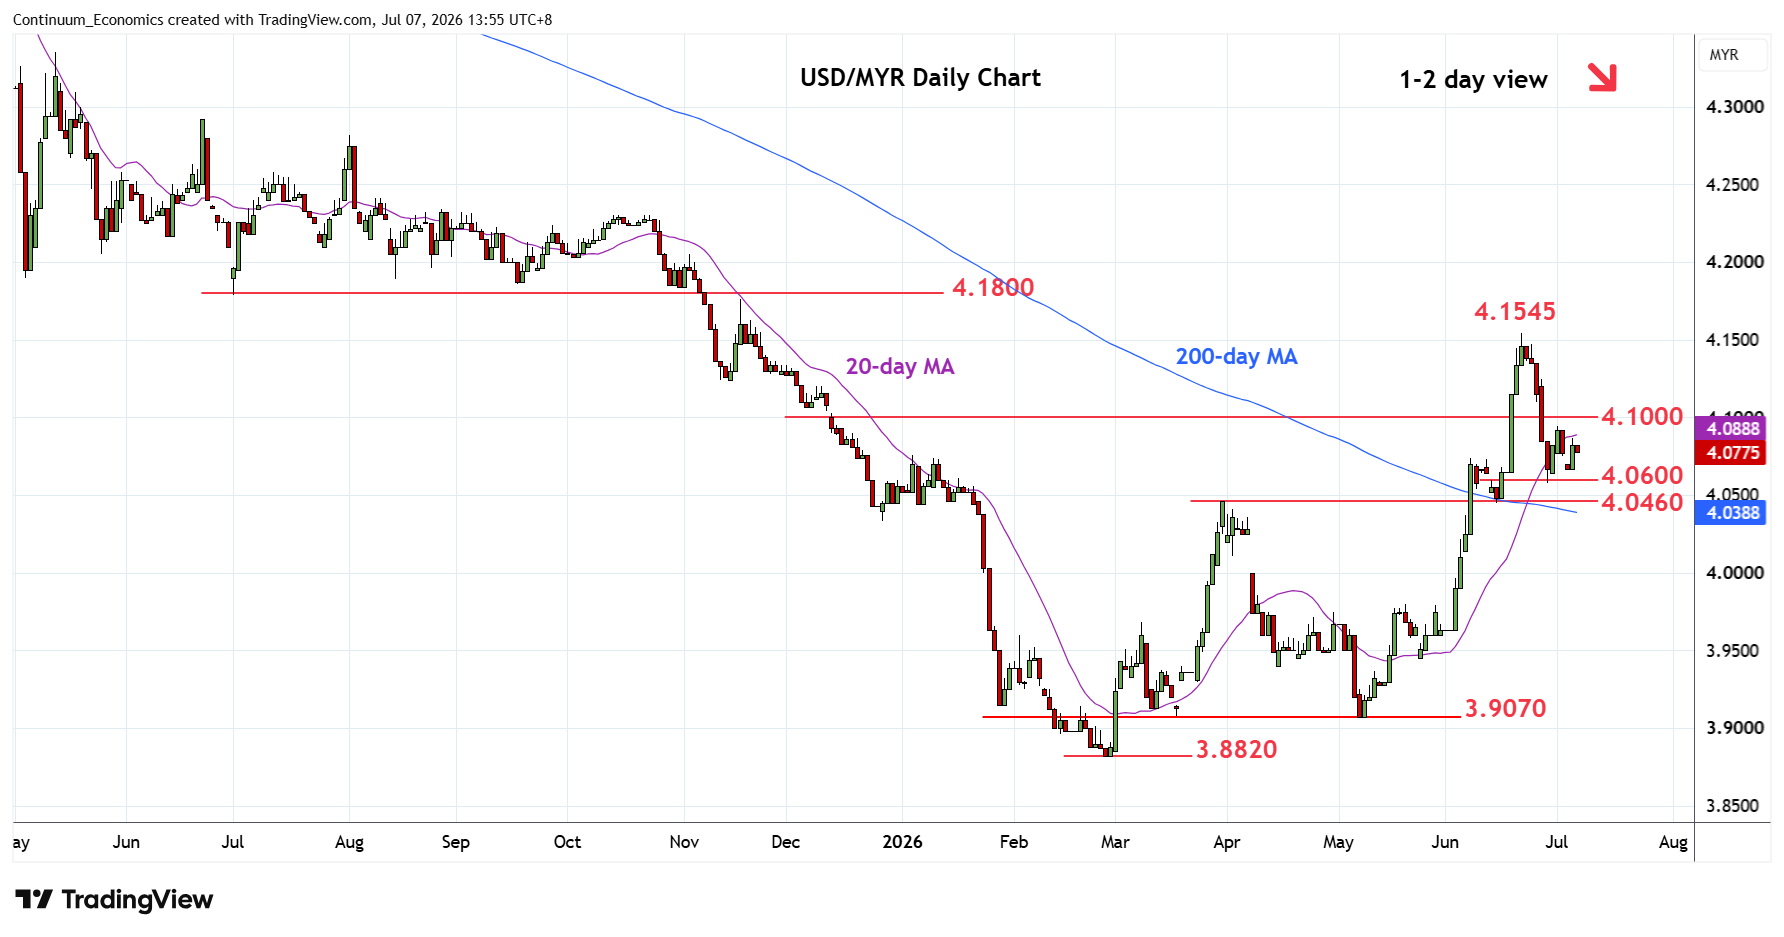
Edged higher from test of the 4.0600 level as prices consolidate losses from the 4.1545 current year high of 22 June
| Levels | Imp | Comment | Levels | Imp | Comment | |||
|---|---|---|---|---|---|---|---|---|
| R4 | 4.2000 | ** | 50% 2025/2026 fall | S1 | 4.0600 | congestion | ||
| R3 | 4.1800 | ** | 2025 year low | S2 | 4.0460 | ** | Mar high | |
| R2 | 4.1545 | ** | 22 Jun YTD high | S3 | 4.0000 | * | figure | |
| R1 | 4.1000 | * | congestion | S4 | 3.9800 | ** | May high |
Asterisk denotes strength of level
06:00 GMT - Edged higher from test of the 4.0600 level as prices consolidate losses from the 4.1545 current year high of 22 June. The resulting flag pattern suggest scope for break lower to retrace the May/June rally to strong support at 4.0460. Daily and weekly studies have turned lower to unwind overbought readings and threatens break here to see extension to 4.0000 figure and 3.9800 May high. Meanwhile, resistance remains at the 4.0950/4.1000 high of 1 July and congestion area which is expected to cap and sustain losses from the 4.1545 high.