Published: 2026-07-10T04:58:26.000Z
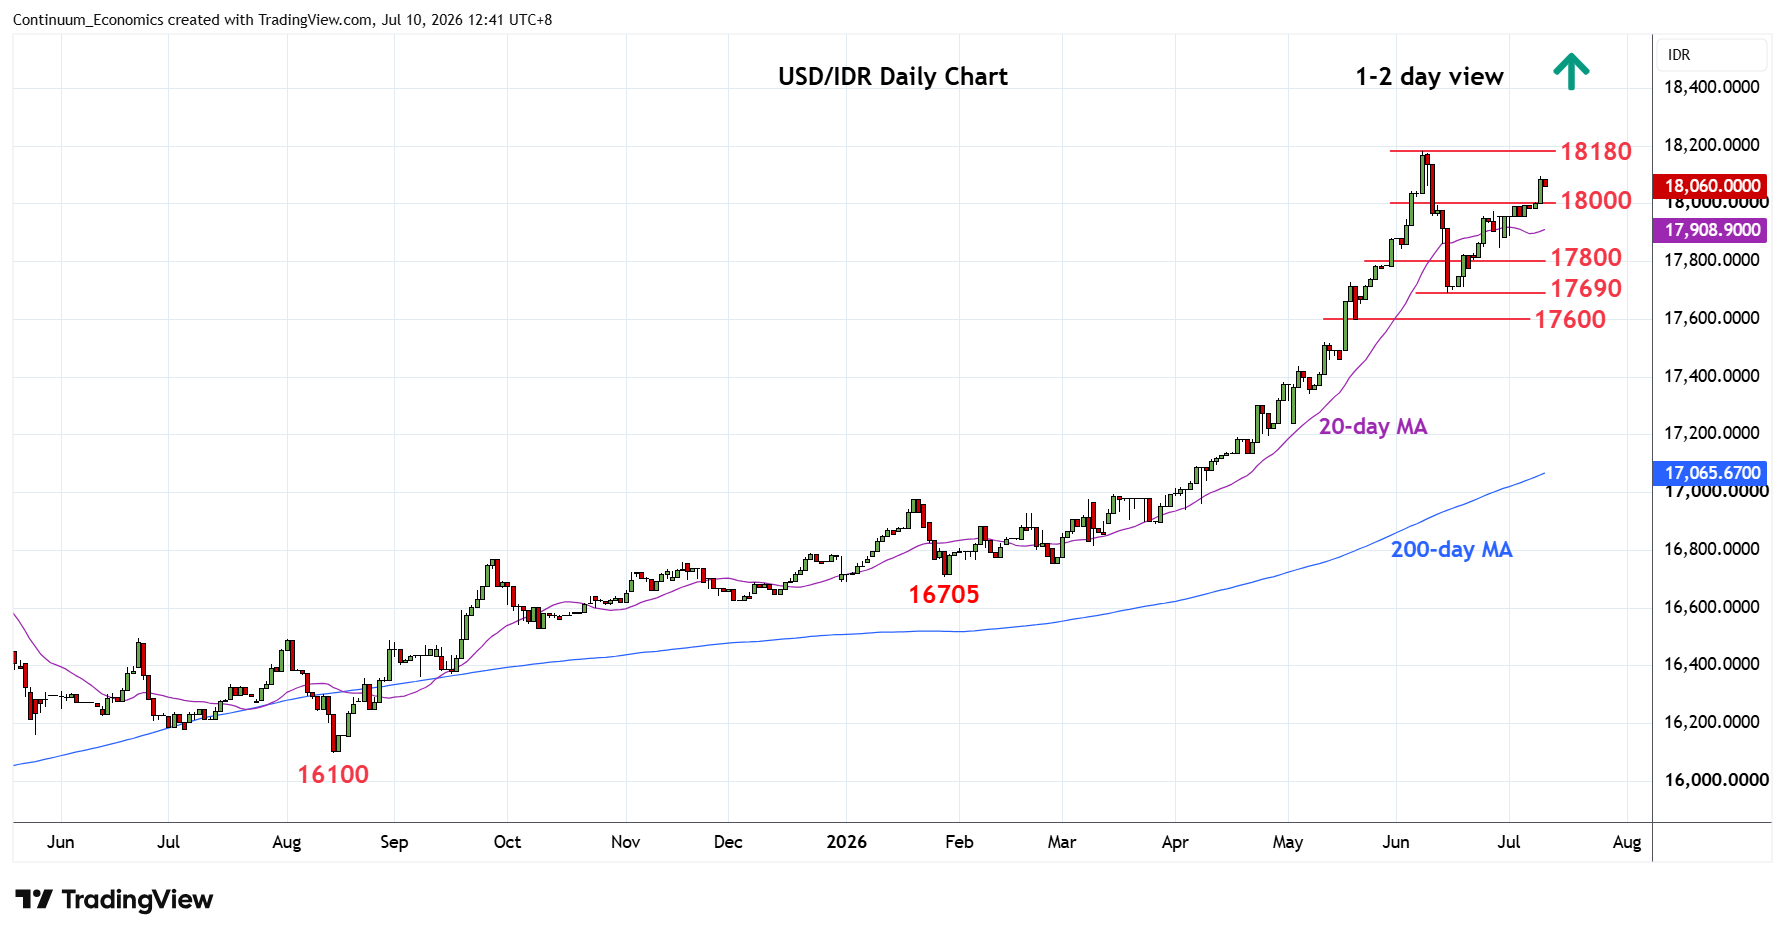
Chart USD/IDR Updates: Within reach of 18180, June all-time high
4
Break above 18000 see prices extending bounce from the 17690 June low to return focus to the 18180 all-time high
| Levels | Imp | Comment | Levels | Imp | Comment | |||
|---|---|---|---|---|---|---|---|---|
| R4 | 18470 | projection | S1 | 18000 | * | congestion | ||
| R3 | 18200 | projection | S2 | 17845 | * | 29 Jun low | ||
| R2 | 18180 | ** | 8 Jun all-time high | S3 | 17800 | * | congestion | |
| R1 | 18095 | * | 9 Jul high | S4 | 17690 | ** | 15 Jun low |
Asterisk denotes strength of level
04:50 GMT - Break above 18000 see prices extending bounce from the 17690 June low to return focus to the 18180 all-time high. Would expect reaction on retest of the latter but bullish prices action suggest scope for break to extend the underlying bull trend. Clearance will see room for extension to 18470 and 18980 projection targets. However, overbought daily studies caution corrective pullback with support starting at the 18000 level. Would take break here to open up room for deeper pullback to support at the 17845/17800 area. Below here and 17690 June low will fade the upside pressure.