Published: 2026-06-18T03:08:09.000Z
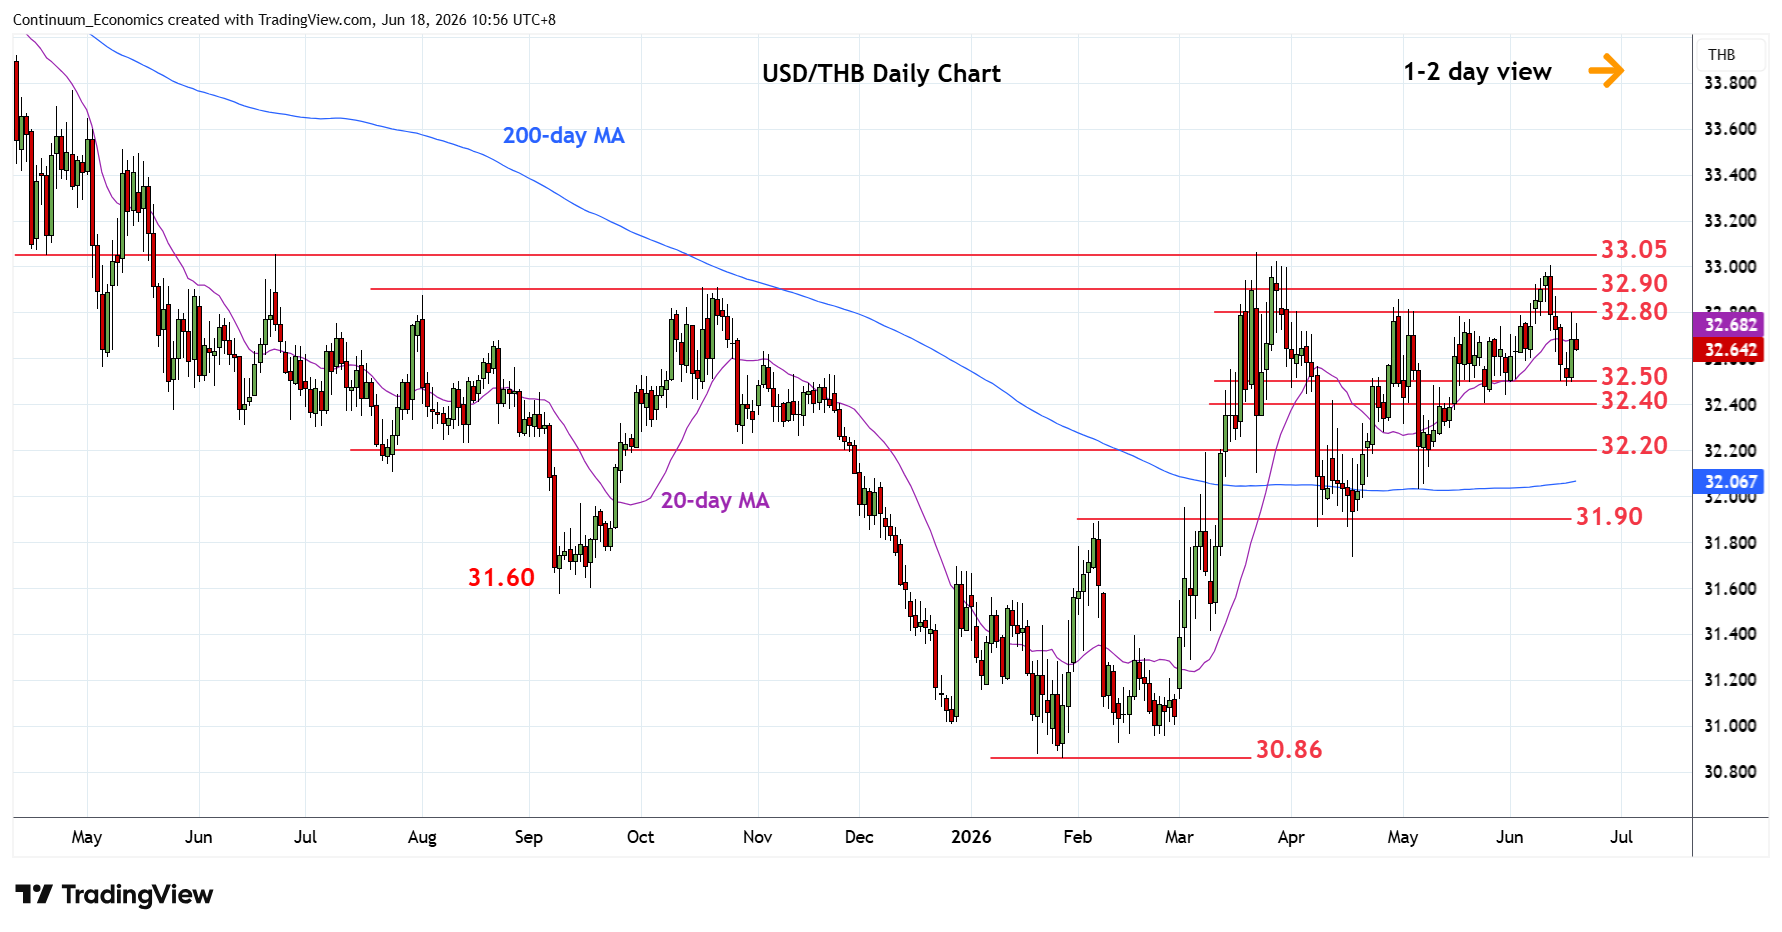
Chart USD/THB Update: Consolidating within 32.50/32.80 area
-
Turned up from the support at the 32.50 congestion as prices unwind oversold intraday studies to consolidate within the 32.50/32.80 area
| Level | Comment | Level | Comment | |||||
|---|---|---|---|---|---|---|---|---|
| R4 | 33.20 | * | congestion | S1 | 32.50 | * | congestion | |
| R3 | 33.00/05 | ** | congestion, 23 Mar YTD high | S2 | 32.40 | ** | 25 May low, congestion | |
| R2 | 32.90 | * | Oct high | S3 | 32.20 | * | congestion | |
| R1 | 32.80 | * | May high | S4 | 32.03/00 | ** | 6 May low, congestion |
Asterisk denotes strength of level
03:00 GMT - Turned up from the support at the 32.50 congestion as prices unwind oversold intraday studies to consolidate within the 32.50/32.80 area. Would take break of the 32.50 and 32.40 support to open up room for deeper pullback to retrace gains from the 31.75 April low. Meanwhile, resistance remains at the 32.80 May high and see break here needed to expose resistance at 33.00 congestion and current year high at 33.05 to retest. Clearance here will further retrace losses from the April 2025 year high.