Published: 2026-07-02T04:58:08.000Z
Chart USD/INR Update: Extend corrective bounce from June low
1
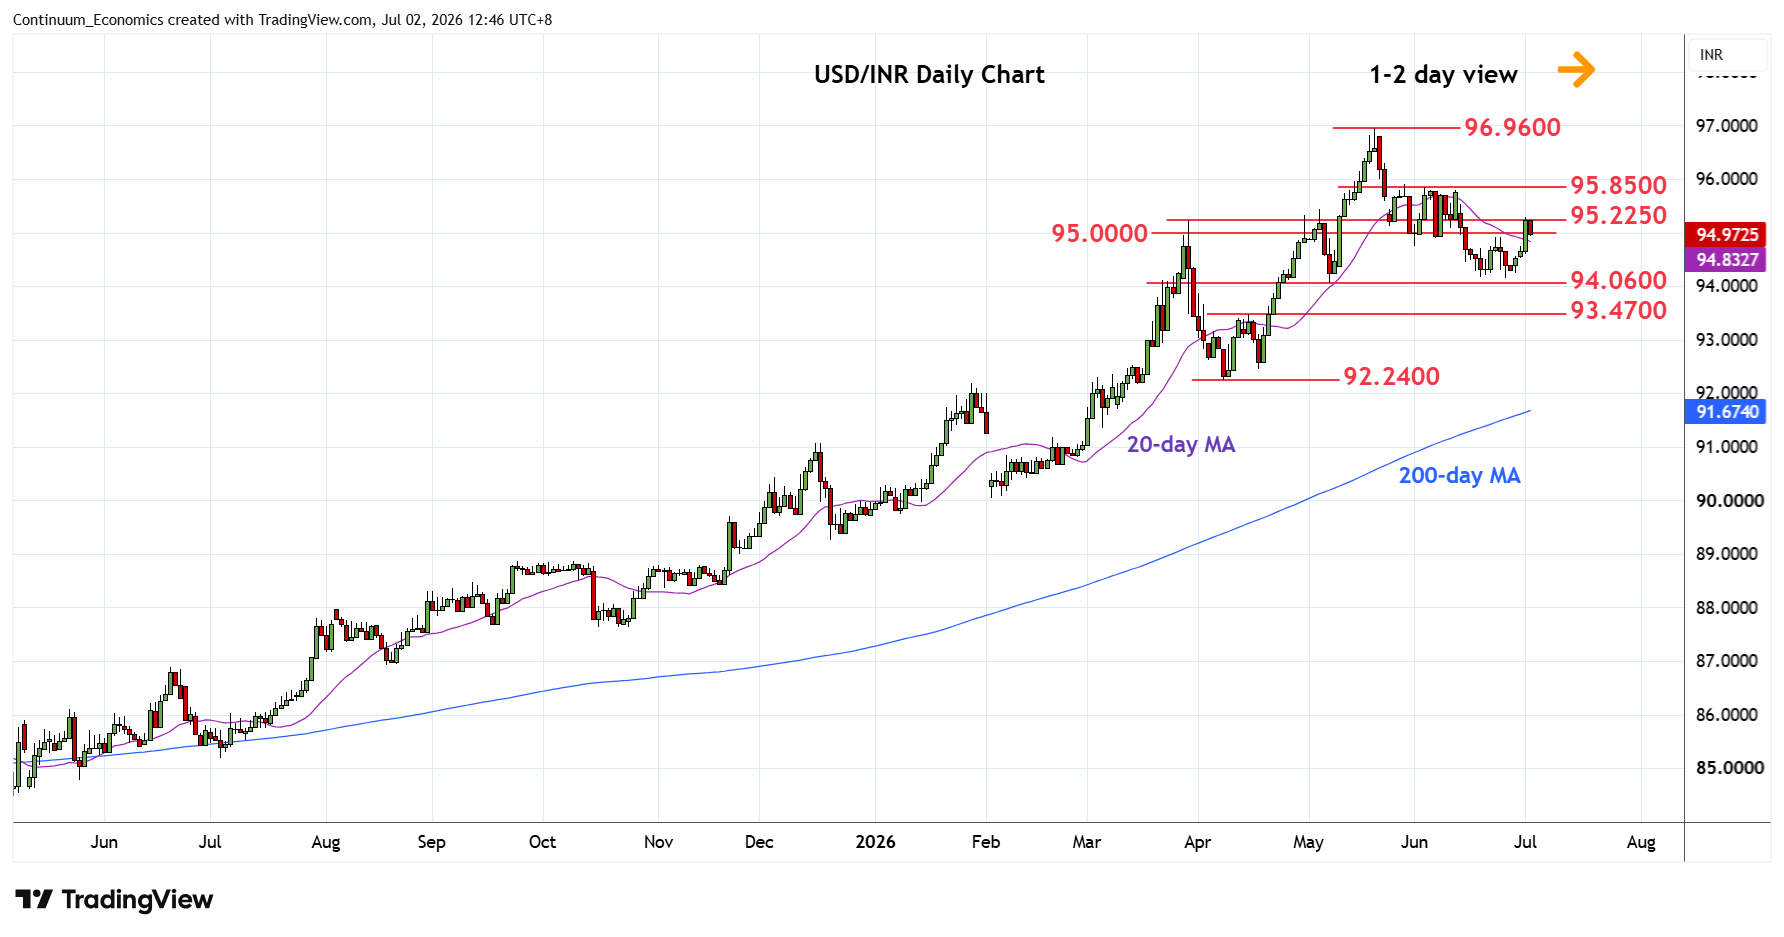
Turned up in consolidation from the 94.1450 low has seen break above the 95.0000 level to retest the 95.2250 March high
| Level | Comment | Level | Comment | |||||
|---|---|---|---|---|---|---|---|---|
| R4 | 96.3000 | 22 May high | S1 | 94.1450 | * | Jun low | ||
| R3 | 96.0000 | * | figure | S2 | 94.0600 | ** | May low | |
| R2 | 95.8500 | ** | Jun high | S3 | 93.4700 | ** | 15 Apr high | |
| R1 | 95.2250 | ** | Mar high | S4 | 93.0000 | * | figure |
Asterisk denotes strength of level
04:50 GMT - Turned up in consolidation from the 94.1450 low has seen break above the 95.0000 level to retest resistance at the 95.2250 March high. Gains above here, if seen, will turn focus to the 95.8500 June high. However, corrective gains are expected to give way to renewed selling pressure later. Break is the 94.1450 low will see scope to retest 94.0600 May low and the 94.0000 figure. Below these will extend losses from the 96.9600 May current year high and see extension to support at 93.4700 then the 93.0000 figure.