Published: 2026-09-22T04:59:52.000Z
Chart USD/IDR Updates: Extending gains
4
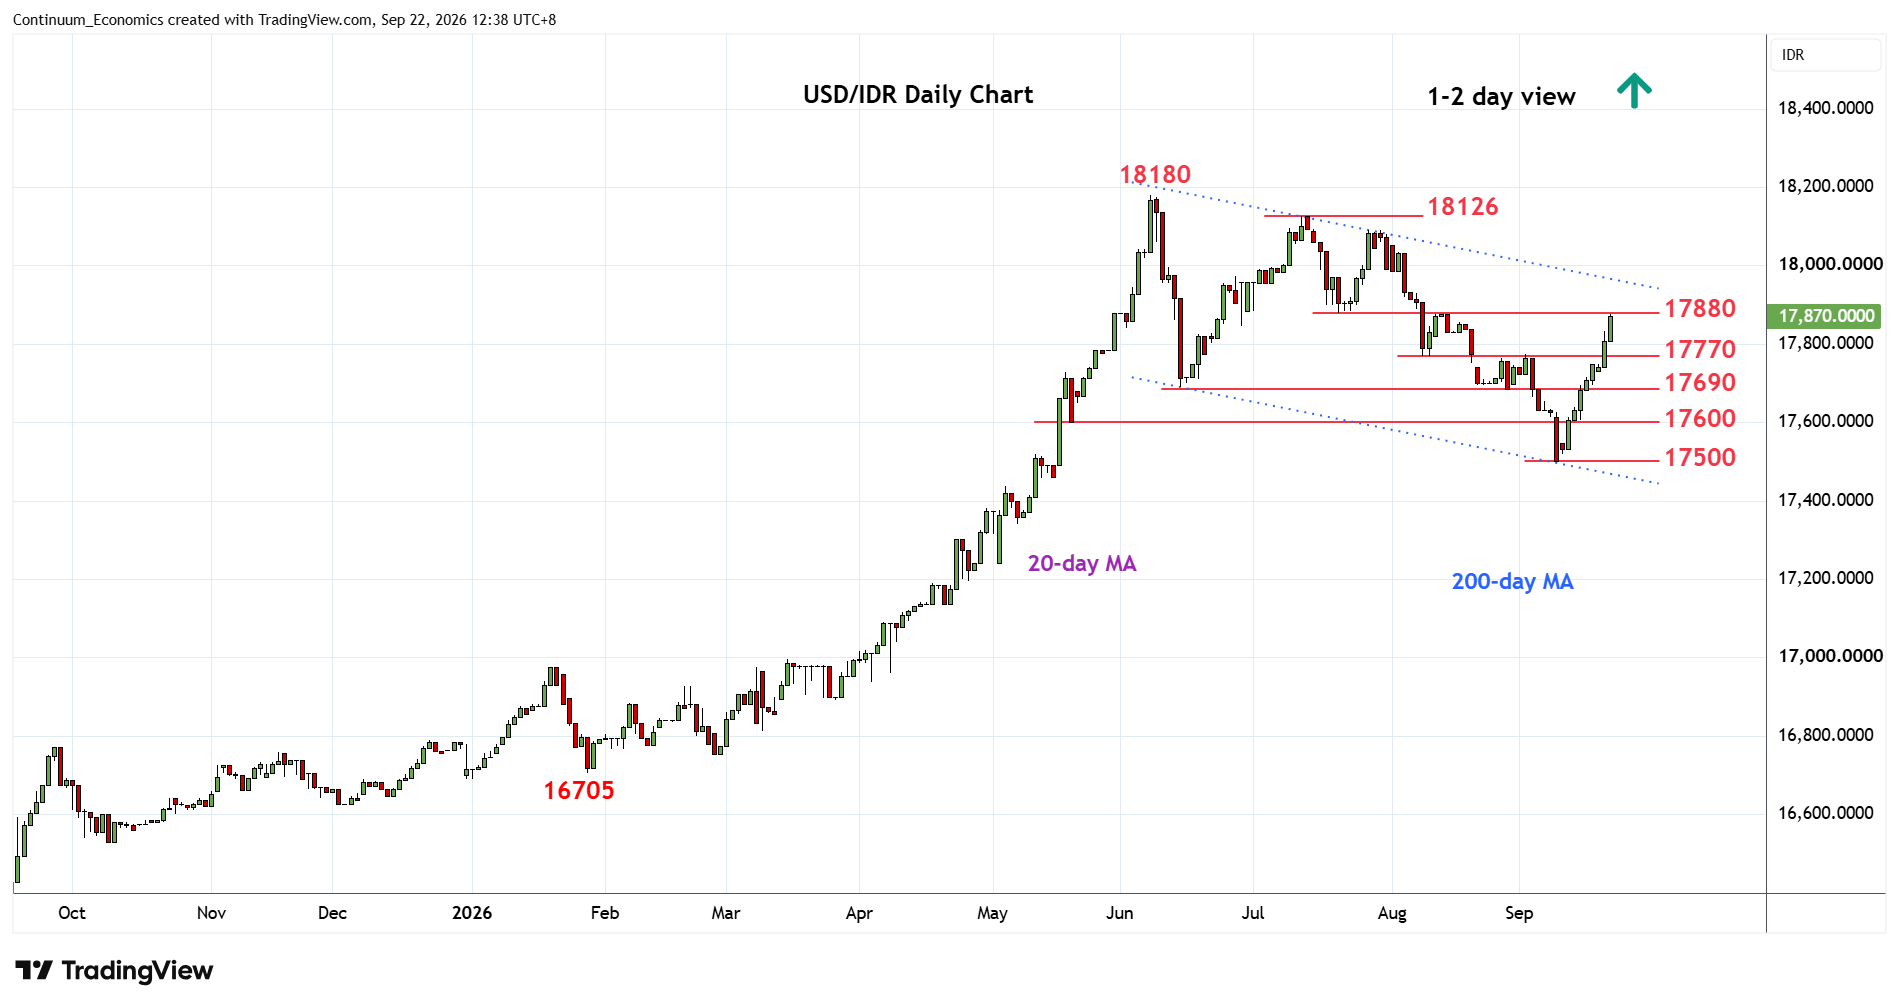
Starting the week on a bullish tone to extend gains from the 17500 low of 9 September to reach strong resistance at 17880/17900
| Levels | Imp | Comment | Levels | Imp | Comment | |||
|---|---|---|---|---|---|---|---|---|
| R4 | 18126 | ** | 13 Jul high | S1 | 17770 | * | 10 Aug low | |
| R3 | 18090 | * | 28 Jul high | S2 | 17690 | ** | Jun low | |
| R2 | 18000 | * | figure | S3 | 17600 | * | congestion | |
| R1 | 17880/900 | ** | Jul low, congestion | S4 | 17500 | ** | 9 Sep low |
Asterisk denotes strength of level
04:50 GMT - Starting the week on a bullish tone to extend gains from the 17500 low of 9 September to reach strong resistance at 17880/17900, July low and congestion area. Overbought daily studies suggest reaction here can be expected but a later break cannot be ruled out. Higher will see room for extension to channel resistance at 17960 then the 18000 level. Meanwhile, support is raised to the 17770/17750 area and extending to 17690, August low. Would take break of the latter to fade the upside pressure and see return to the 17600 congestion then the 17500 low.