Chart USD/BRL Update: Edging higher - background studies improving
Cautious trade is giving way to fresh gains
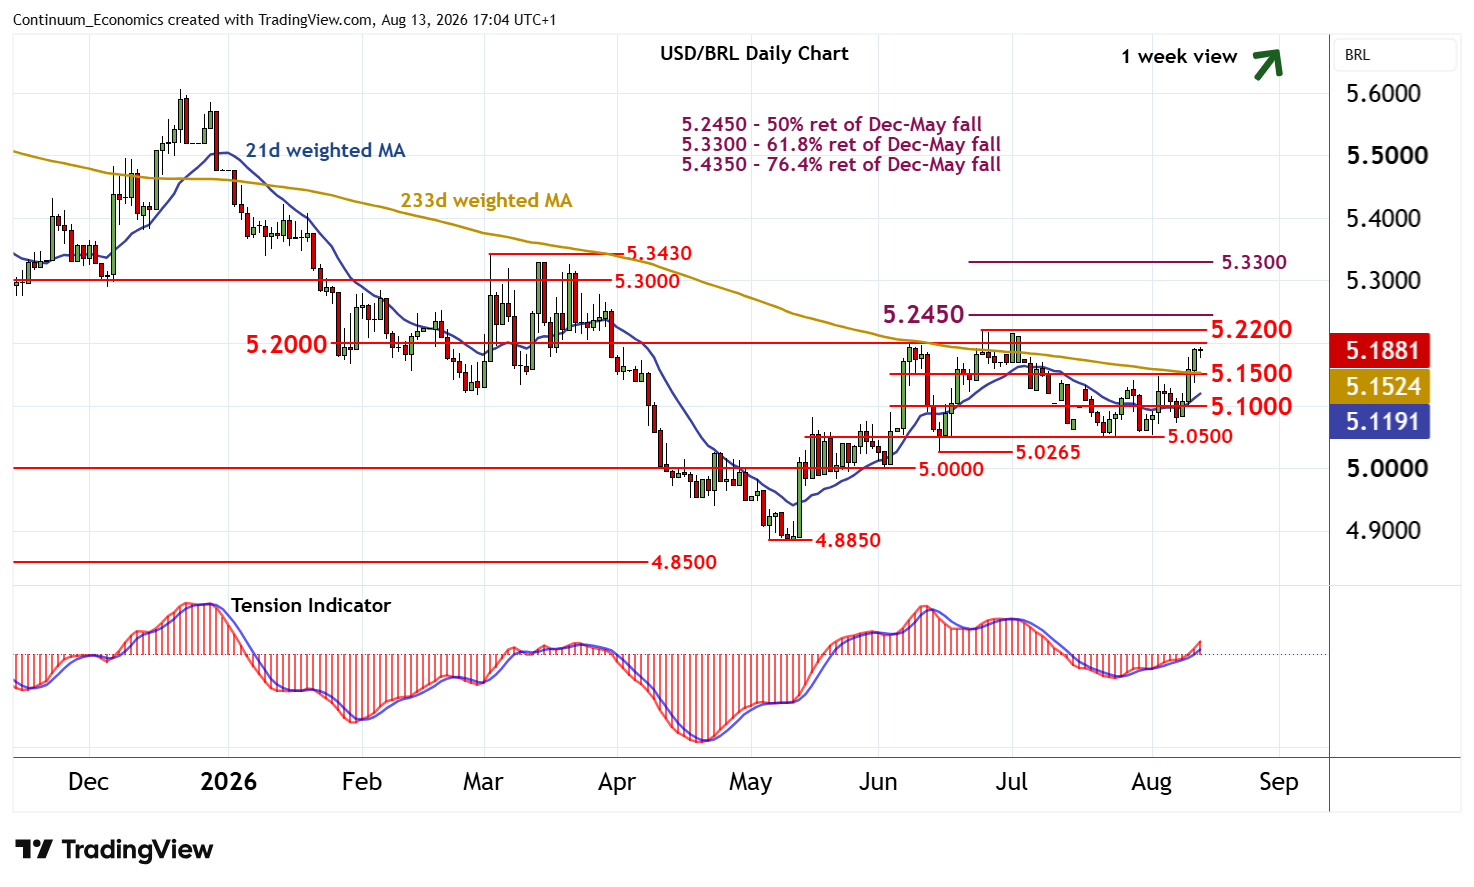
| Levels | Imp | Comment | Levels | Imp | Comment | |||
|---|---|---|---|---|---|---|---|---|
| R4 | 5.3000 | ** | congestion | S1 | 5.1500 | * | break level | |
| R3 | 5.2450 | ** | 50% ret of Dec-May fall | S2 | 5.1000 | * | break level | |
| R2 | 5.2200 | ** | 24 Jun (m) high | S3 | 5.0500 | * | break level | |
| R1 | 5.2000 | ** | congestion | S4 | 5.0265 | * | 15 Jun (w) low |
Asterisk denotes strength of level
16:50 BST - Cautious trade is giving way to fresh gains, with prices approaching strong resistance at congestion around 5.2000 and the 5.2200 monthly high of 24 June. Daily stochastics are now overbought, suggesting any immediate tests could give way to consolidation. However, the positive daily Tension Indicator and improving weekly charts highlight room for a later break. Focus will then turn to the 5.2450 Fibonacci retracement, with a further close above here completing the broad multi-week accumulation pattern and extending May gains towards 5.3000.
Meanwhile, support is at 5.1500 and extends to 5.1000. This range should underpin any immediate setbacks. An unexpected close beneath here will open up 5.0500, where more significant buying interest is expected to appear.