Published: 2026-06-18T04:39:28.000Z
Chart USD/IDR Updates: Higher in consolidation from 17690 low
3
Turned up in consolidation from the 17690 low as prices unwind oversold intraday and daily studies
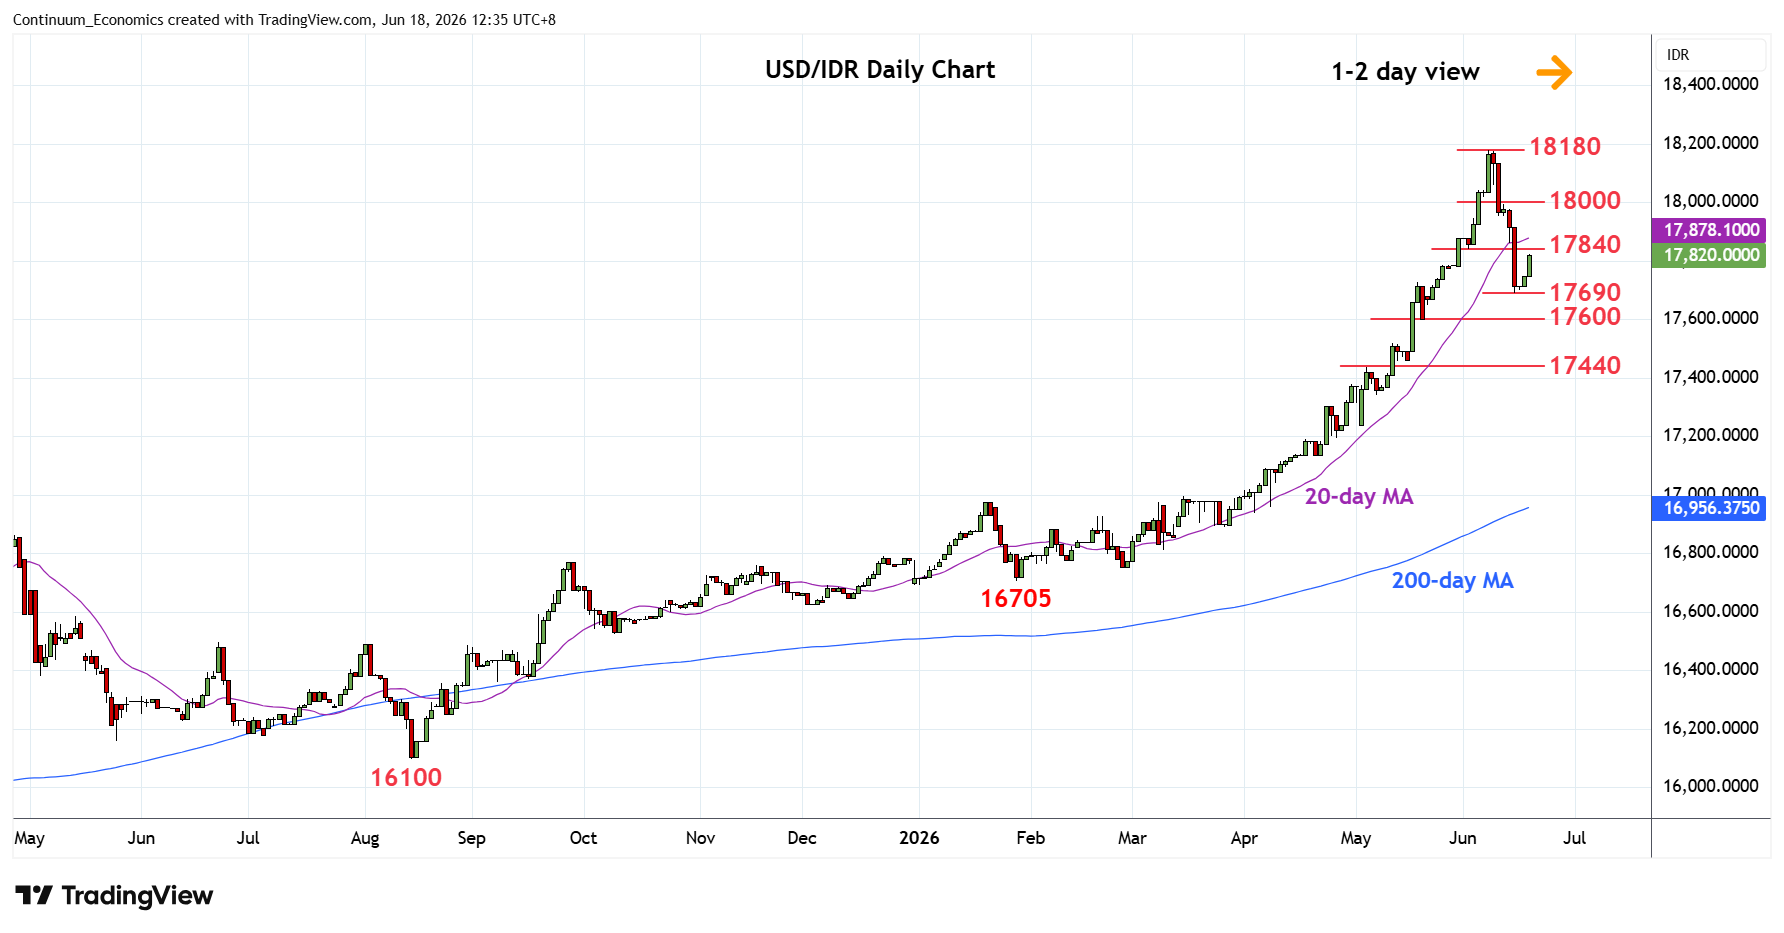
| Levels | Imp | Comment | Levels | Imp | Comment | |||
|---|---|---|---|---|---|---|---|---|
| R4 | 18200 | projection | S1 | 17600 | * | 38.2% Jan/Jun rally | ||
| R3 | 18180 | ** | 8 Jun all-time high | S2 | 17520 | * | 12 May high | |
| R2 | 18000 | * | figure | S3 | 17440 | * | 5 May high, 50% | |
| R1 | 17840 | * | 2 Jun low | S4 | 17340 | * | 7 May low |
Asterisk denotes strength of level
04:35 GMT - Turned up in consolidation from the 17690 low as prices unwind oversold intraday and daily studies. However, consolidation is expected to give way to renewed selling pressure later and see room for extension to the support at the 17600 congestion and 38.2% Fibonacci level. Lower will further retrace gains from the 16705 January YTD low to 17520/17500 congestion area and 17440, 50% Fibonacci level. Meanwhile, resistance at the 17800/17840 congestion area is expected to cap corrective bounce and sustain losses from the 18180 high.