Published: 2026-07-10T05:36:51.000Z
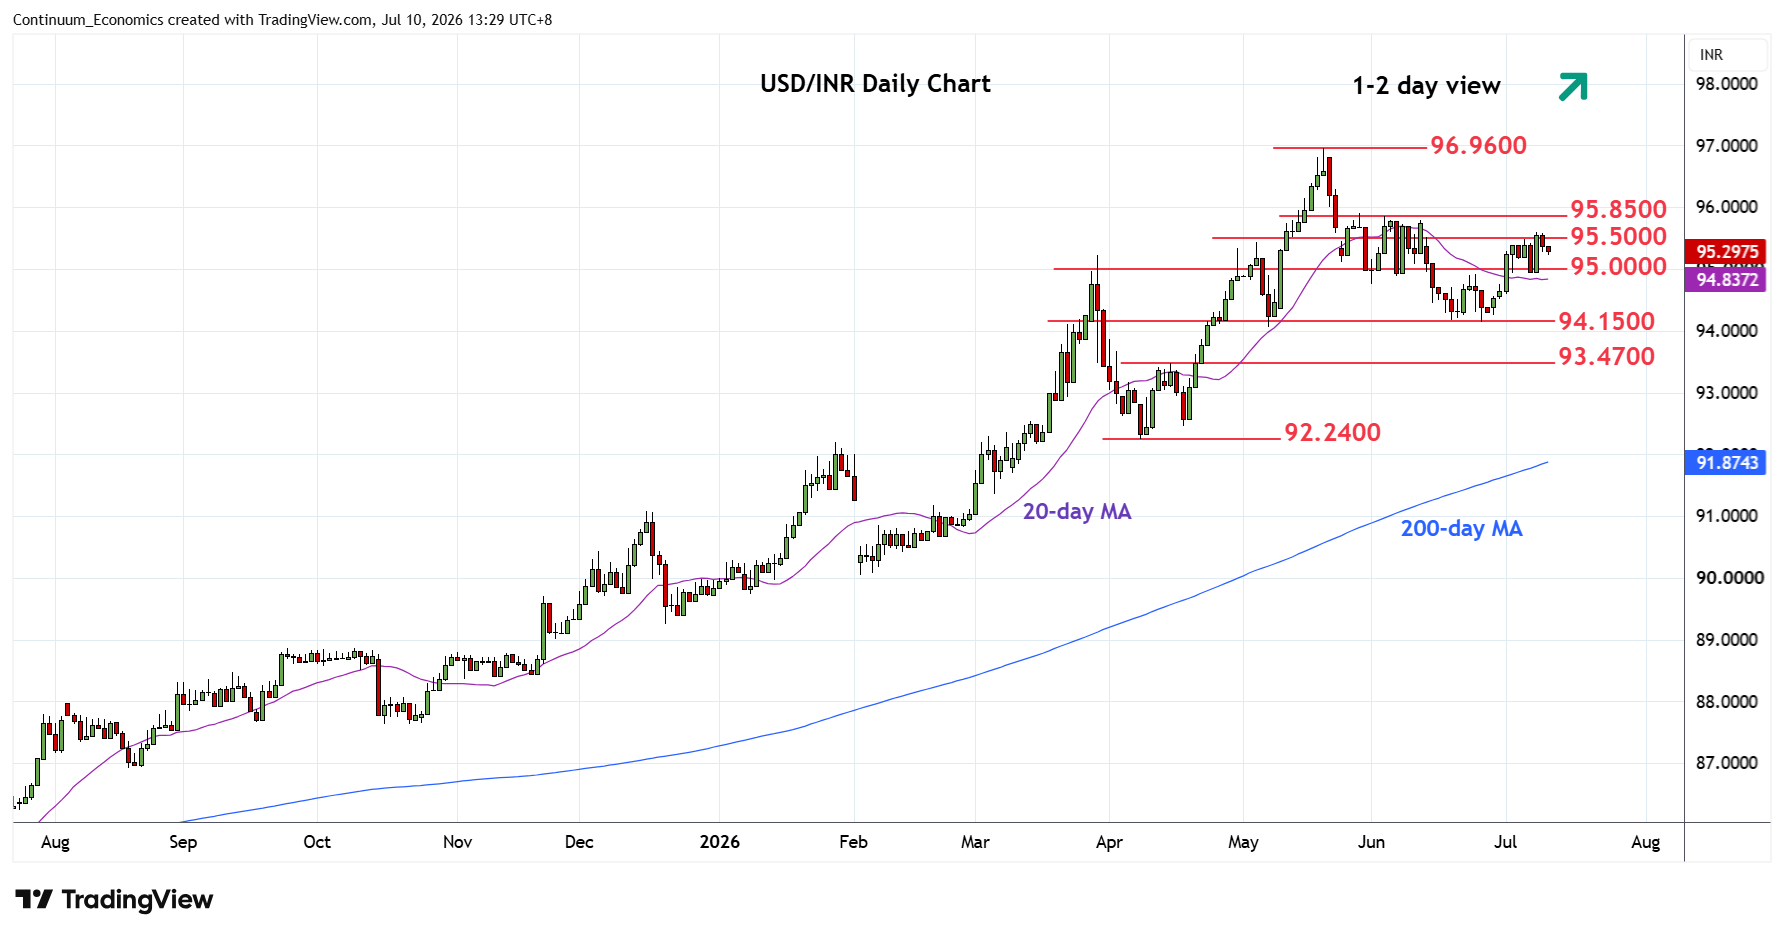
Chart USD/INR Update: Consolidating at 95.5000 resistance
1
No follow-through on break above the 95.5000 level as prices drift lower to consolidate gains from the 94.1500 low
| Level | Comment | Level | Comment | |||||
|---|---|---|---|---|---|---|---|---|
| R4 | 96.3000 | 22 May high | S1 | 95.0000 | * | congestion | ||
| R3 | 96.0000 | * | figure | S2 | 94.1500 | ** | Jun low | |
| R2 | 95.8500 | ** | Jun high | S3 | 94.0000 | figure | ||
| R1 | 95.5000 | * | 6 Jul high | S4 | 93.4700 | ** | 15 Apr high |
Asterisk denotes strength of level
05:30 GMT - No follow-through on break above the 95.5000 level as prices drift lower to consolidate gains from the 94.1500 low. Daily studies are stretched but further gains cannot be ruled out. Higher will see room to resistance at 95.8500 June high and the 96.0000 figure which is expected to cap and give way to renewed selling pressure later. Meanwhile, support is at the 95.0000/94.9000 area. Would take break here to ease the upside pressure and return focus to the downside for retest of 94.5000 congestion then the 94.1500 June low.