Published: 2026-09-08T04:29:29.000Z
Chart USD/IDR Updates: Extending losses
3
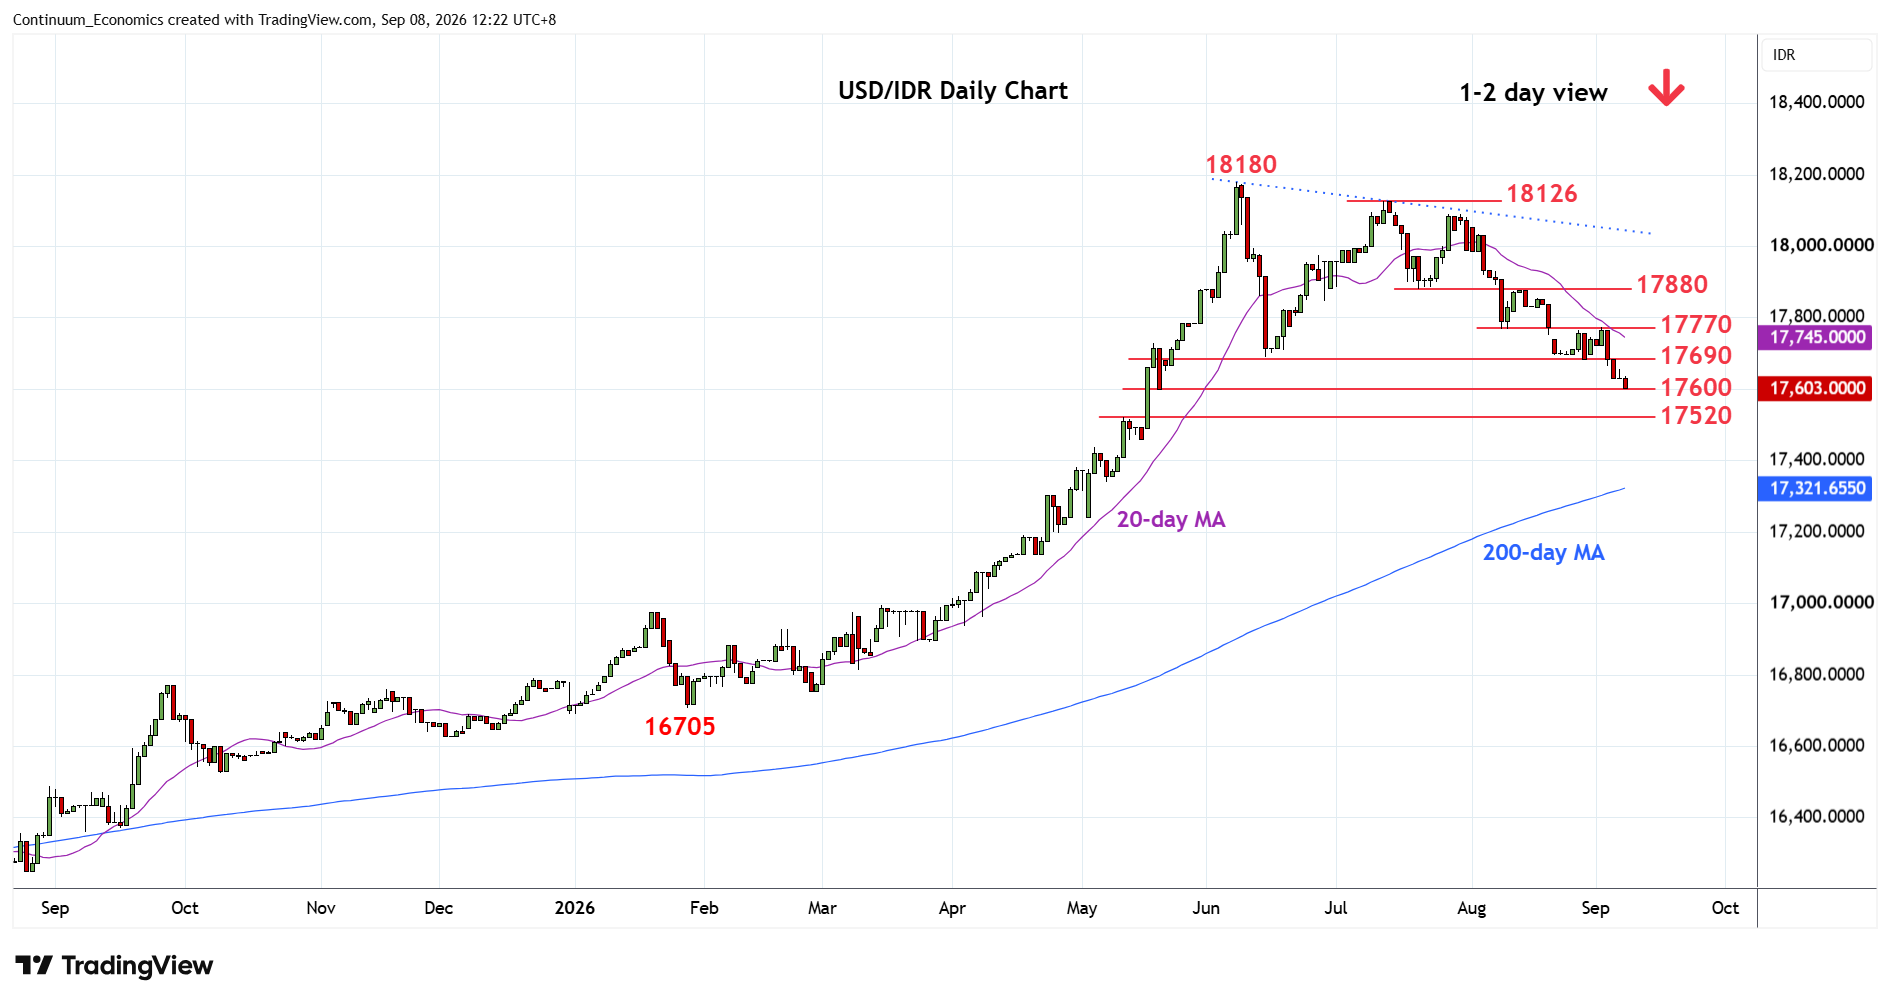
Under pressure and break of the 17630 low of last week see prices extending losses from the 18180 June current year high
| Levels | Imp | Comment | Levels | Imp | Comment | |||
|---|---|---|---|---|---|---|---|---|
| R4 | 18000 | * | congestion | S1 | 17600 | * | 20 May low | |
| R3 | 17880/900 | ** | Jul low, congestion | S2 | 17520 | * | 12 May high | |
| R2 | 17770 | * | 10 Aug low | S3 | 17385 | * | 38.2% 2025/2026 rally | |
| R1 | 17690 | ** | Jun low | S4 | 17300 | * | congestion |
Asterisk denotes strength of level
04:30 GMT - Under pressure and break of the 17630 low of last week see prices extending losses from the 18180 June current year high to reach 17600 low. Negative daily and weekly weighs and lower will see room for further losses to retrace gains from the August 2025 year low. Lower will see room to the 17520/17500 support and congestion area. Lower still, will target 17385, 38.2% Fibonacci level. Meanwhile, resistance is lowered to 17690 June low which is expected to cap. Close above here, if seen, will see room for stronger bounce to resistance at the 17770/17800, area.