Published: 2026-10-15T02:50:55.000Z
Chart USD/CNH Update: Pressuring 6.6910 current year low
1
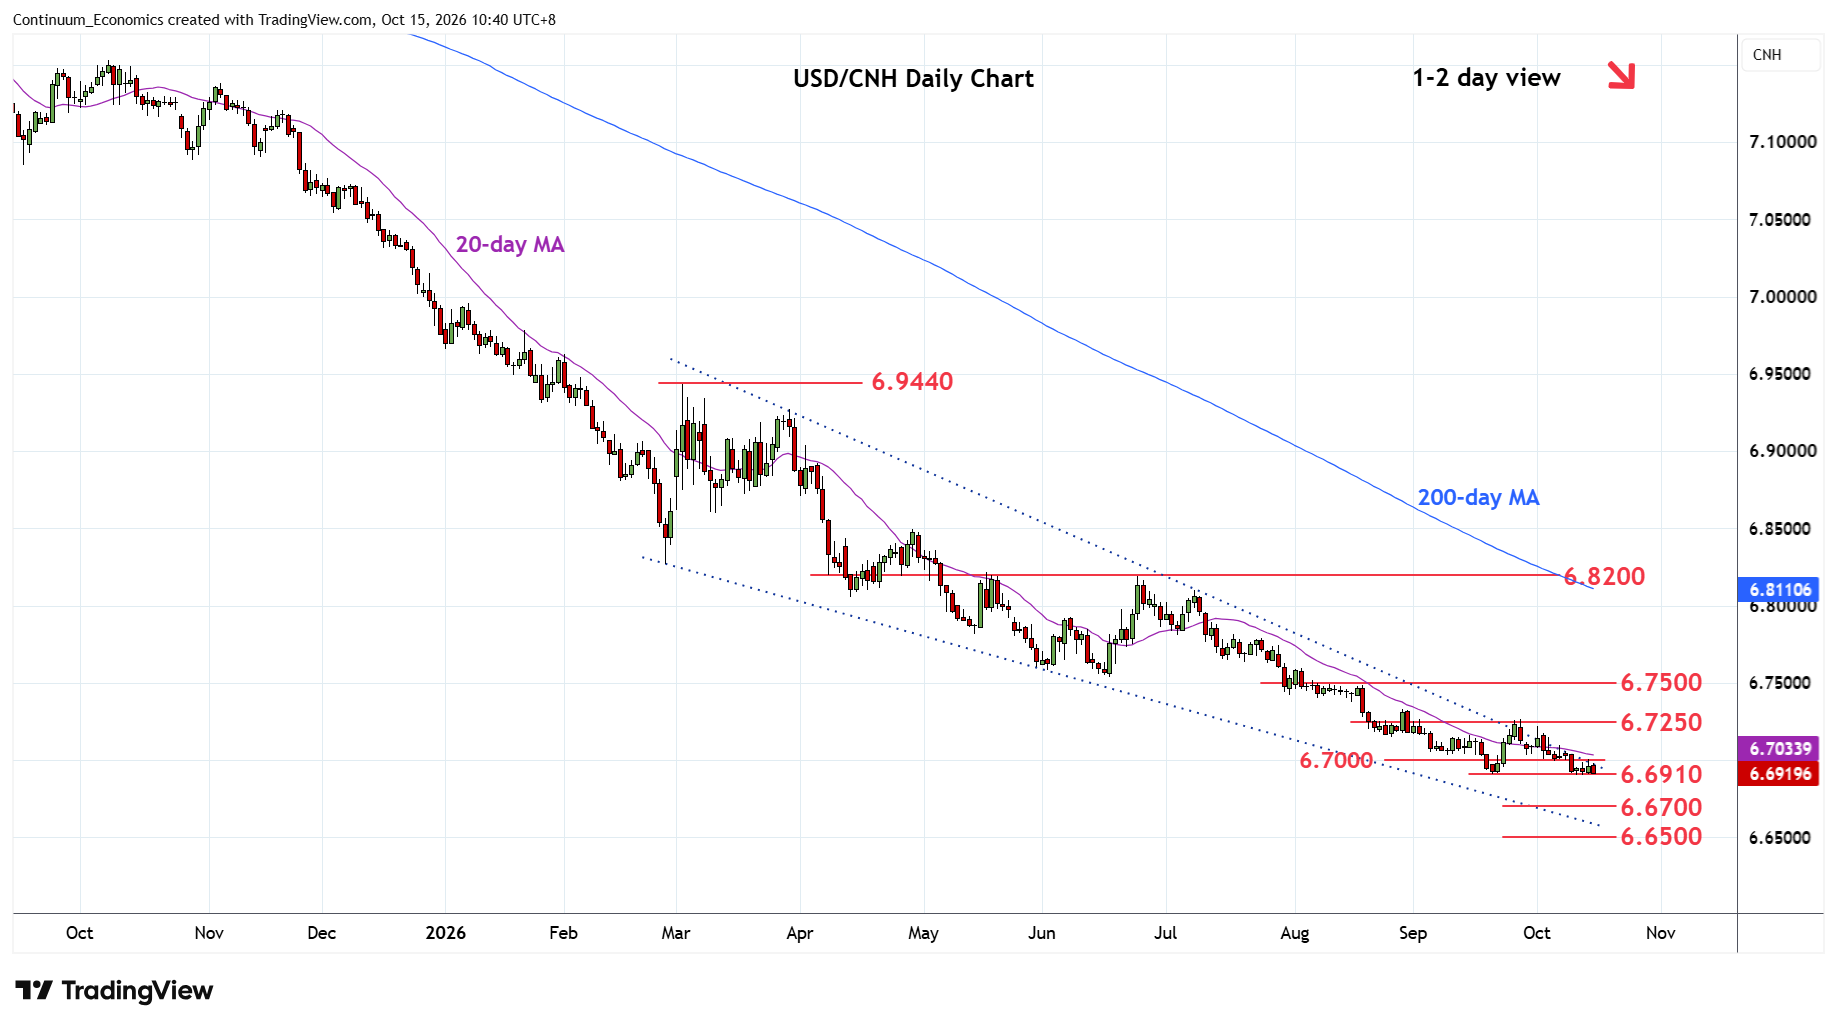
Bounce attempt saw the 6.7000 level capping and subsequent pullback here see pressure returning to the 6.6910, September current year low
| Level | Imp | Comment | Level | Imp | Comment | |||
|---|---|---|---|---|---|---|---|---|
| R4 | 6.7500/40 | ** | congestion, Jun low | S1 | 6.6910 | ** | 21 Sep YTD low | |
| R3 | 6.7400 | * | 7 Aug low, congestion | S2 | 6.6700 | ** | 2023 year low | |
| R2 | 6.7250 | * | congestion | S3 | 6.6500 | * | congestion | |
| R1 | 6.7000 | * | figure | S4 | 6.6160 | * | Jun 2022 low |
Asterisk denotes strength of level
02:45 GMT - Bounce attempt saw the 6.7000 level capping and subsequent pullback here see pressure returning to the 6.6910, September current year low. Risk is seen for break here to extend the underlying bear trend from the 2025 year high. Lower will see scope for extension to strong support at the 6.6700/6.6500, 2023 year low and congestion area. Meanwhile, resistance remains at the 6.7000 level. Would need to regain this to ease the downside pressure and and see room for stronger bounce to resistance at the 6.7200/6.7250 area.