Published: 2026-06-04T03:21:09.000Z
Chart USD/MYR Update: Extending May gains
1
Consolidation below 3.9800 May high has given way to break to extend gains from the 3.9070 low
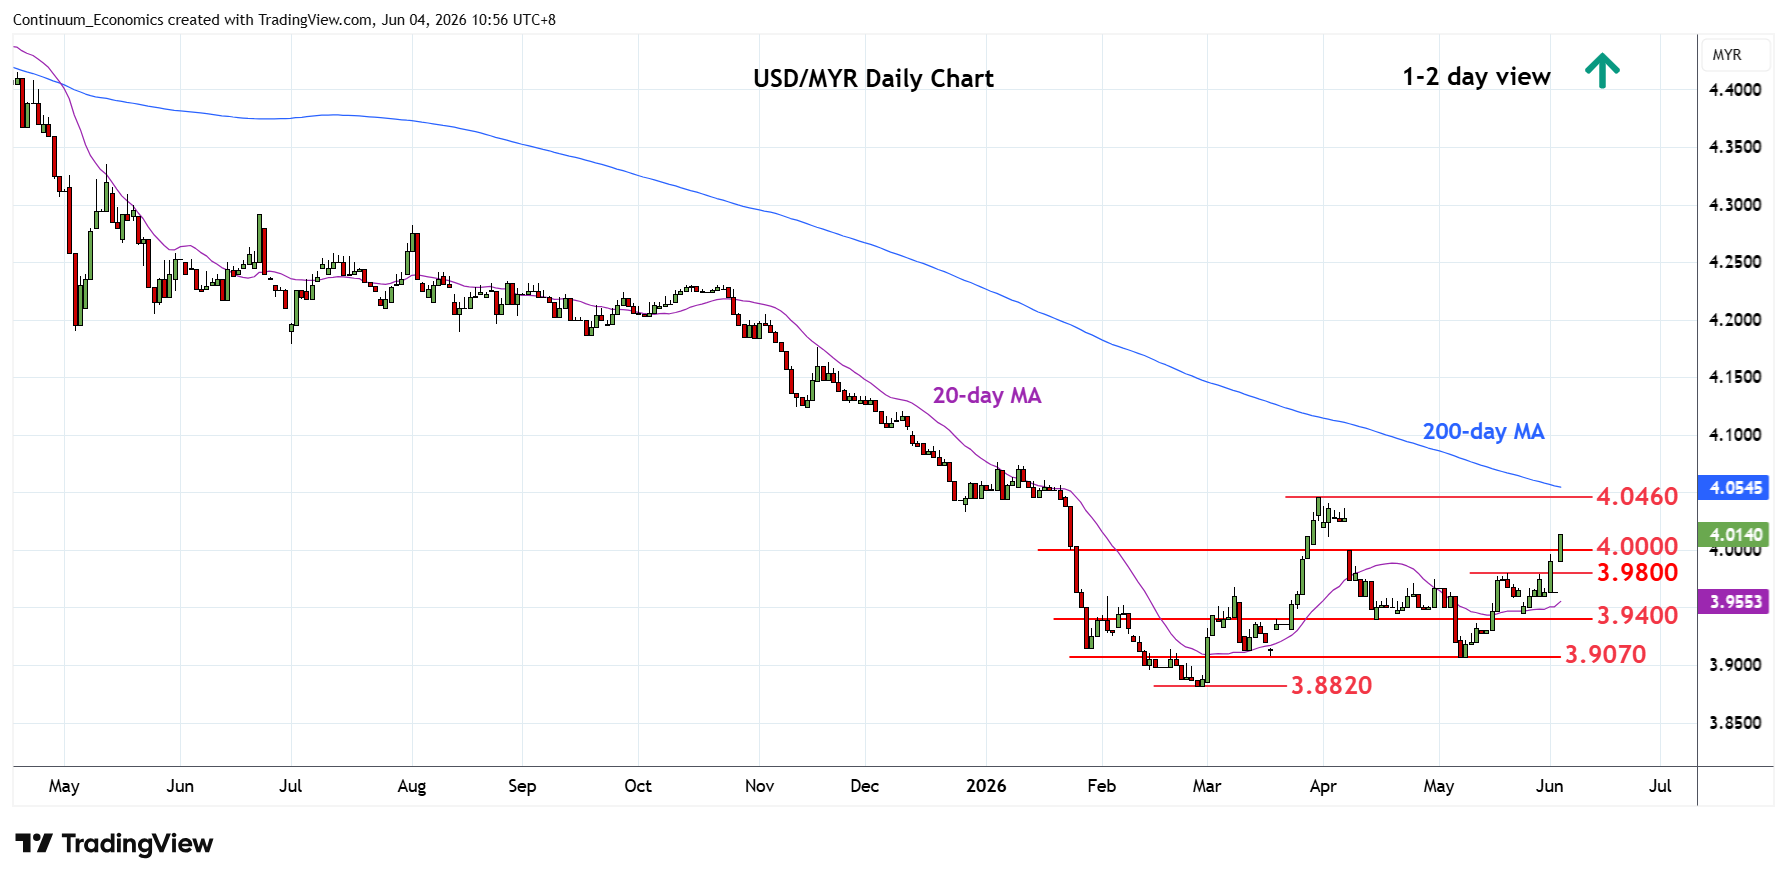
| Levels | Imp | Comment | Levels | Imp | Comment | |||
|---|---|---|---|---|---|---|---|---|
| R4 | 4.1000 | ** | figure, 2024 yr low | S1 | 3.9800 | * | May high | |
| R3 | 4.0760 | ** | 5 Jan YTD high | S2 | 3.9400 | * | Apr low | |
| R2 | 4.0460 | ** | 31 Mar high | S3 | 3.9070 | ** | 7 May low | |
| R1 | 4.0200 | * | congestion | S4 | 3.8820 | ** | 26 Feb YTD low |
Asterisk denotes strength of level
03:10 GMT - Consolidation below 3.9800 May high has given way to break to extend gains from the 3.9070 May low. Above the 4.0000 figure opens up room for retest of the 4.0200 congestion then the strong resistance at 4.0460 March high. Break here, if seen, will open up room for stronger correction of the sharp losses from 4.5165 2025 year high and see room to 4.0760, January YTD high. Meanwhile, support is raised to 3.9800 May high which should underpin and sustain bullish gains from the 3.9070 low.