Published: 2026-06-19T03:04:49.000Z
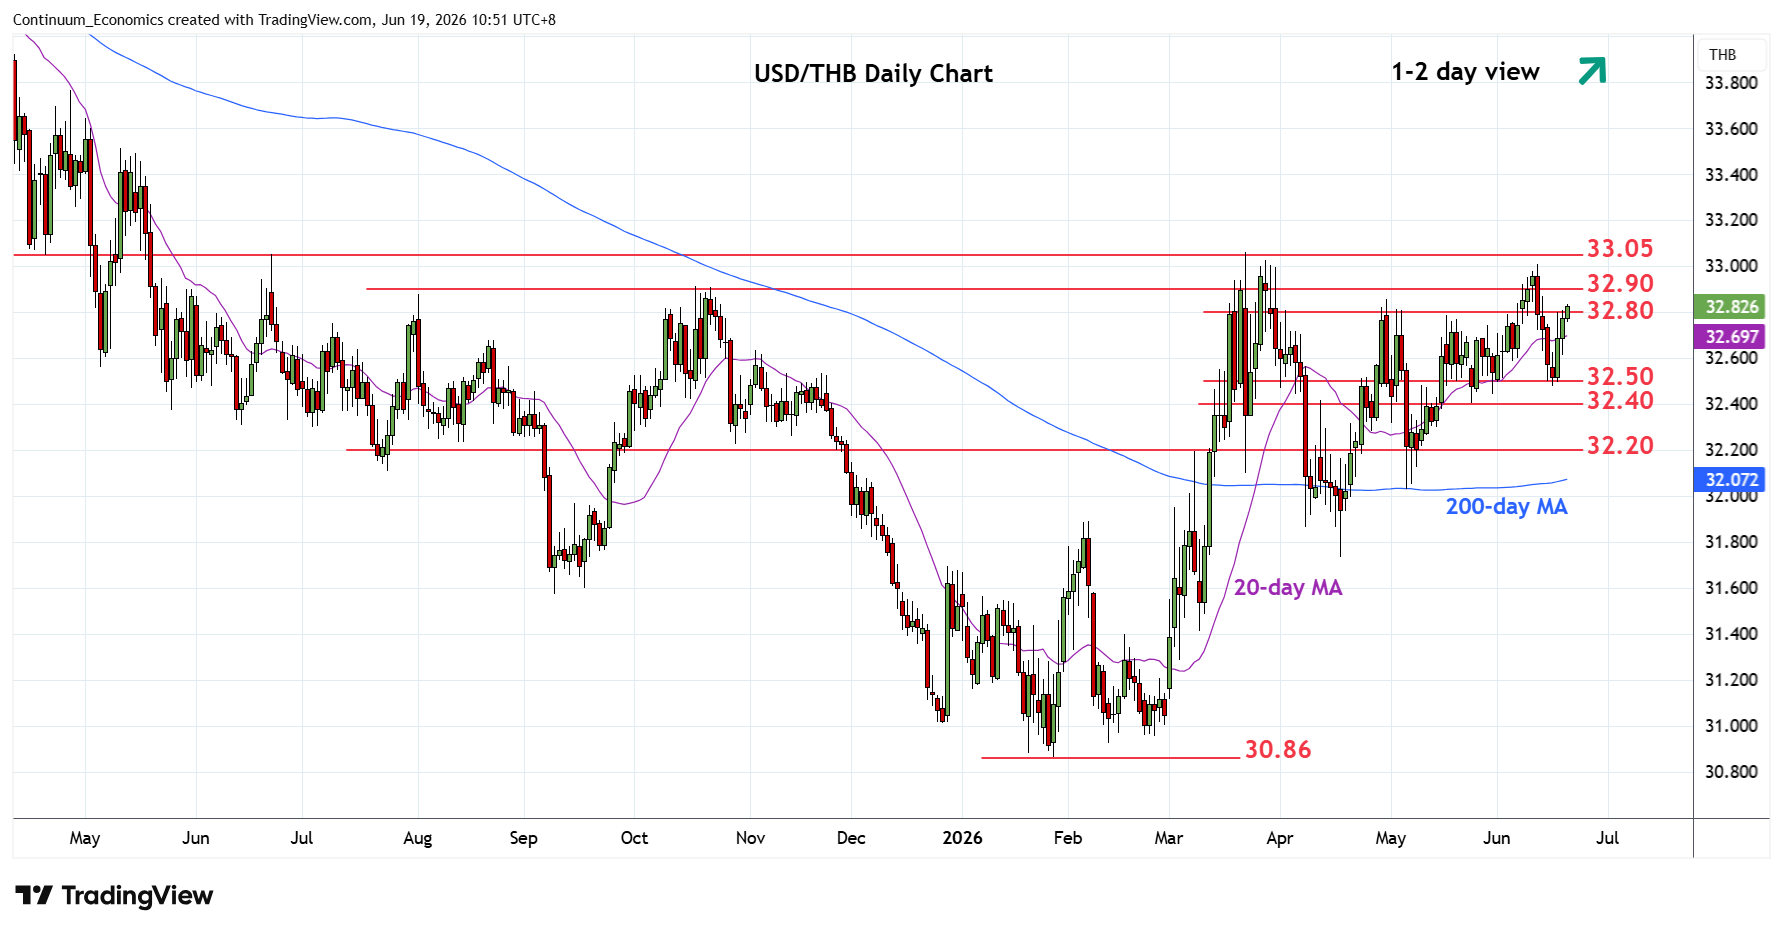
Chart USD/THB Update: Pressuring 32.80/32.90 resistance
-
Extending bounce from the 32.50 congestion to retest resistance at the 32.80/32.90 May/October highs
| Level | Comment | Level | Comment | |||||
|---|---|---|---|---|---|---|---|---|
| R4 | 33.20 | * | congestion | S1 | 32.50 | * | congestion | |
| R3 | 33.00/05 | ** | congestion, 23 Mar YTD high | S2 | 32.40 | ** | 25 May low, congestion | |
| R2 | 32.90 | * | Oct high | S3 | 32.20 | * | congestion | |
| R1 | 32.80 | * | May high | S4 | 32.03/00 | ** | 6 May low, congestion |
Asterisk denotes strength of level
03:00 GMT - Extending bounce from the 32.50 congestion to retest resistance at the 32.80/32.90 May/October highs. Break here will expose resistance at 33.00 congestion and March current year high at 33.05 to retest. Clearance here will confirm a broad 12-month bottom at the January low and further retrace losses from the April 2025 year high. Higher will see room to the 33.20/40 congestion and 61.8% Fibonacci level. Meanwhile, support is raised to the 32.60/50 congestion area which should underpin and gains from the 31.75 April low.