Chart USD/MXN Update: Minor bounce from fresh year low
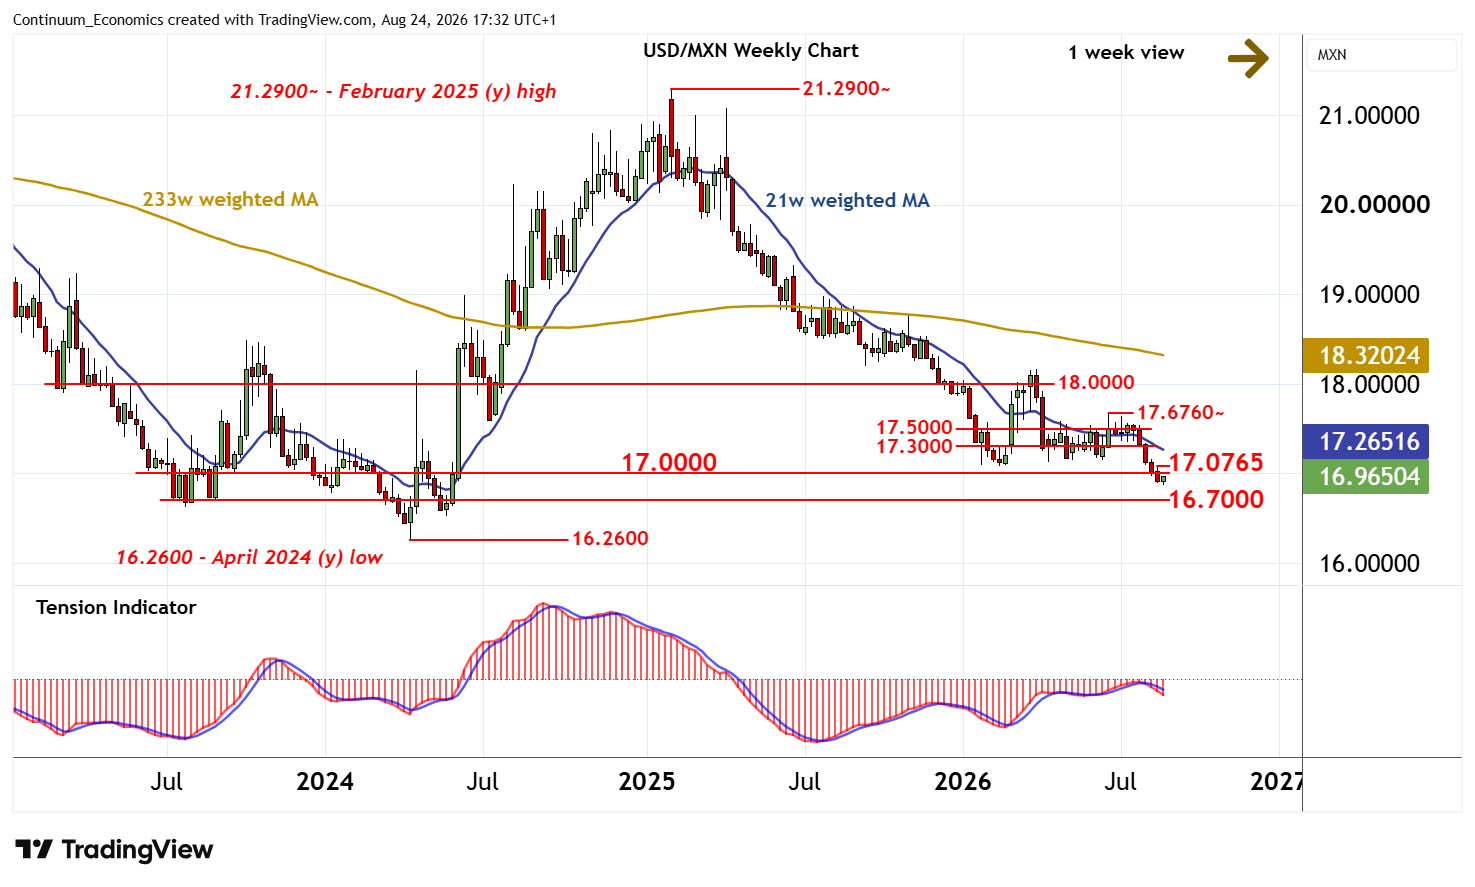
The anticipated break below 17.0000 has posted a fresh year low around 16.8750
| Levels | Imp | Comment | Levels | Imp | Comment | |||
|---|---|---|---|---|---|---|---|---|
| R4 | 17.3000 | * | break level | S1 | 16.8750 | intraday low | ||
| R3 | 17.2000 | * | break level | S2 | 16.7000 | * | congestion | |
| R2 | 17.0765 | * | 18 Aug (w) high | S3 | 16.5275 | * | May 2024 low | |
| R1 | 17.0000 | ** | congestion | S4 | 16.2600 | ** | April 2024 (y) low |
Asterisk denotes strength of level
17:10 BST - The anticipated break below 17.0000 has posted a fresh year low around 16.8750, where a tick higher in oversold daily stochastics and the flattening bearish daily Tension Indicator are prompting a bounce. Immediate focus is back on resistance at 17.0000 and the 17.0765 weekly high of 18 August. However, negative weekly charts should limit any initial tests of this range in consolidation. A close above here, however, will improve sentiment and extend gains towards strong resistance at 17.3000.
Following cautious/corrective gains, fresh losses are looked for. However, a close below the 16.8750 intraday lows is needed to turn sentiment negative once again and extend February 2025 losses initially towards congestion around 16.7000.