Published: 2026-06-17T02:10:46.000Z
Chart USD/SGD Update: Consolidating above 1.2800, scope for break
1
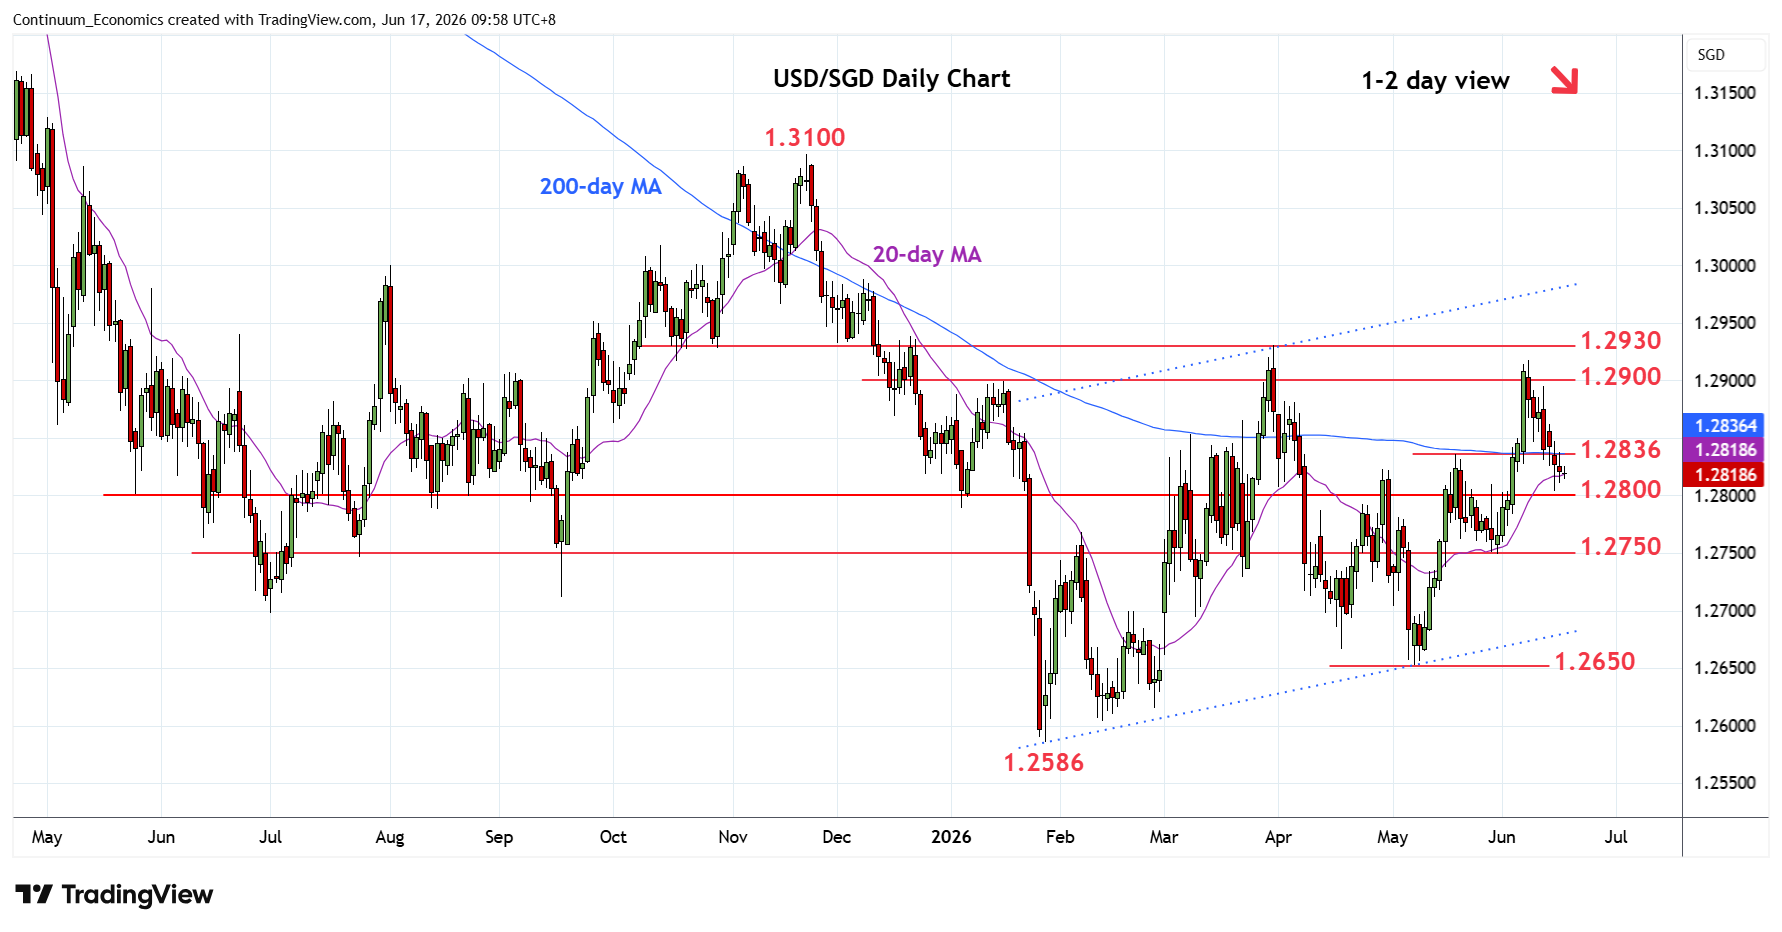
Turned up above support at the 1.2800 congestion as prices consolidate losses from the 1.2918 high of last week
| Level | Comment | Level | Comment | ||||
|---|---|---|---|---|---|---|---|
| R4 | 1.2930 | ** | 31 Mar YTD high | S1 | 1.2800 | * | congestion |
| R3 | 1.2918 | ** | 8 Jun high | S2 | 1.2750 | ** | 29 May low |
| R2 | 1.2900 | * | congestion | S3 | 1.2700 | ** | 2025 yr low, congestion |
| R1 | 1.2850 | * | congestion | S4 | 1.2650 | ** | May low |
Asterisk denotes strength of level
02:05 GMT - Turned up above support at the 1.2800 congestion as prices consolidate losses from the 1.2918 high of last week. Daily studies are tracking lower from overbought areas and suggest scope for deeper pullback to extend losses towards strong support at 1.2750/1.2700, the 29 May and 2025 year lows. Meanwhile, resistance is lowered to 1.2836/50 May high and congestion area which is expected to cap. Only above here will ease the downside pressure and clear the way for retest of the 1.2918/30, 8 June and March current year high.