Published: 2026-07-24T04:21:21.000Z
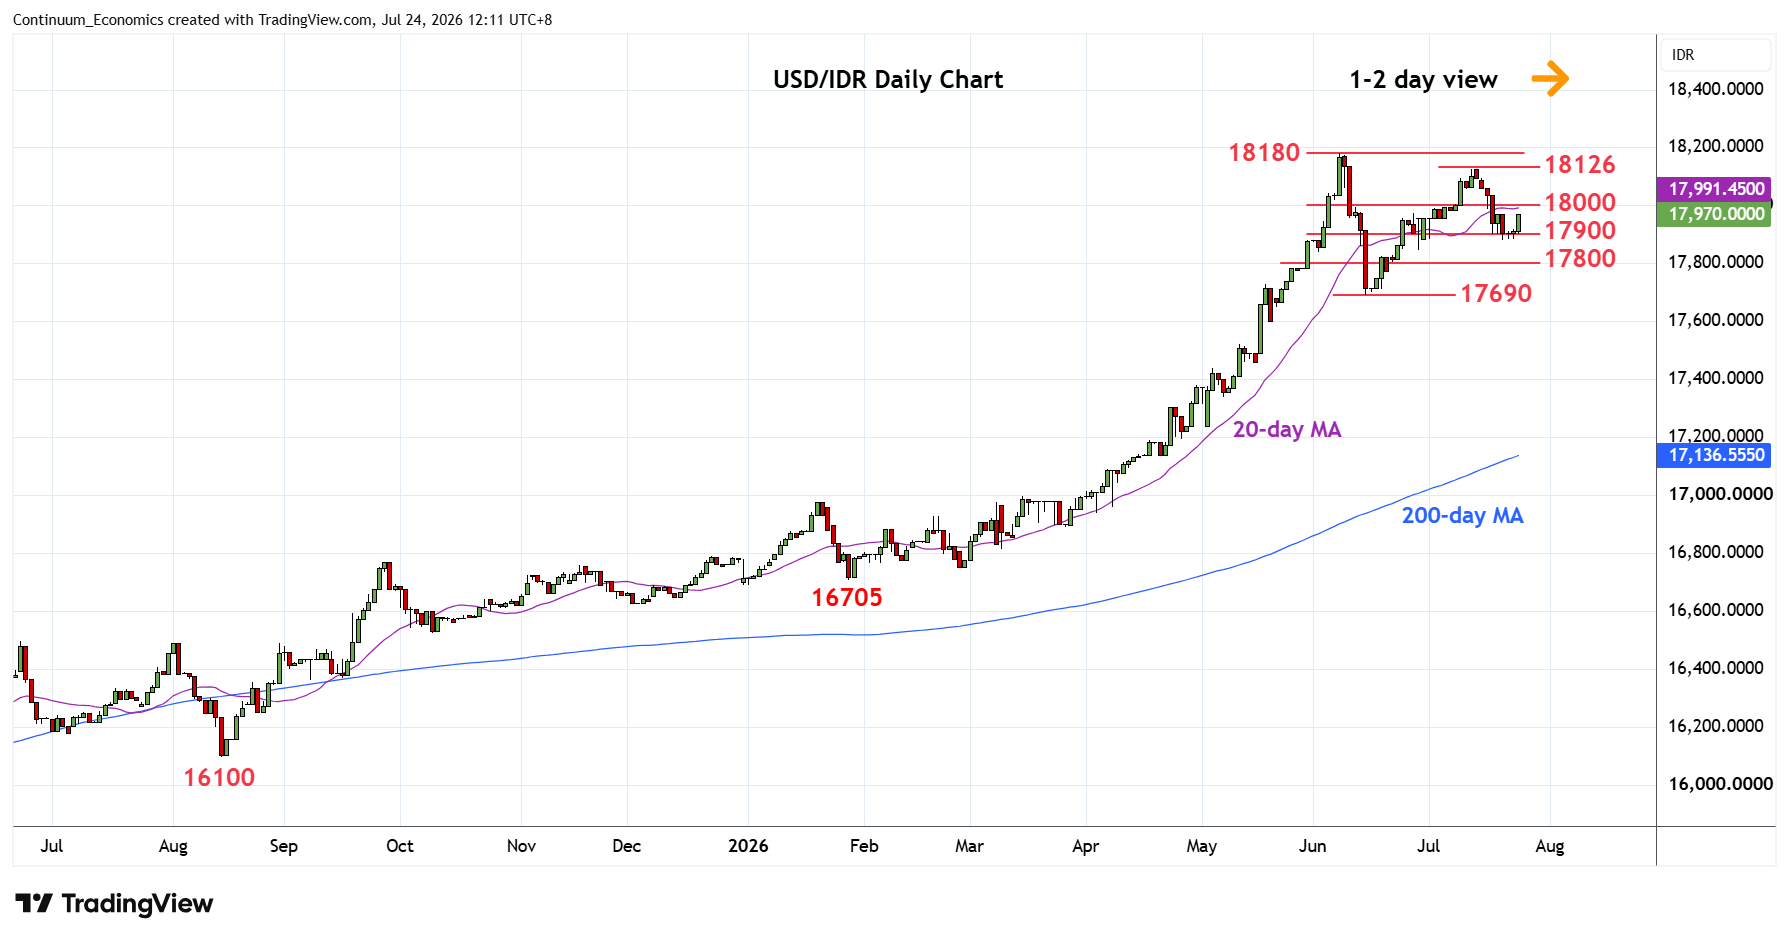
Chart USD/IDR Updates: Turned up in consolidation from 17880 low
3
Consolidation at the 17900 level has given way to bounce as prices unwind oversold intraday and daily studies
| Levels | Imp | Comment | Levels | Imp | Comment | |||
|---|---|---|---|---|---|---|---|---|
| R4 | 18200 | projection | S1 | 17880 | * | 21 Jul low | ||
| R3 | 18180 | ** | 8 Jun all-time high | S2 | 17845 | * | 29 Jun low | |
| R2 | 18126 | * | 13 Jul high | S3 | 17800 | * | congestion | |
| R1 | 18000 | * | congestion | S4 | 17690 | ** | 15 Jun low |
Asterisk denotes strength of level
04:15 GMT - Consolidation at the 17900 level has given way to bounce as prices unwind oversold intraday and daily studies. Resistance is at the 18000 congestion and regaining this needed to clear the way for retest of the 18126 high. However, the latter is expected to cap and give way to renewed selling pressure later. Break of the 17900/17880 support will see room for deeper pullback to retrace strong gains from the 17690 June low to support at the 17845/17800 area. Break above the 18126 high of 13 July will expose the 18180 all-time high to retest.