Published: 2026-06-08T06:01:13.000Z
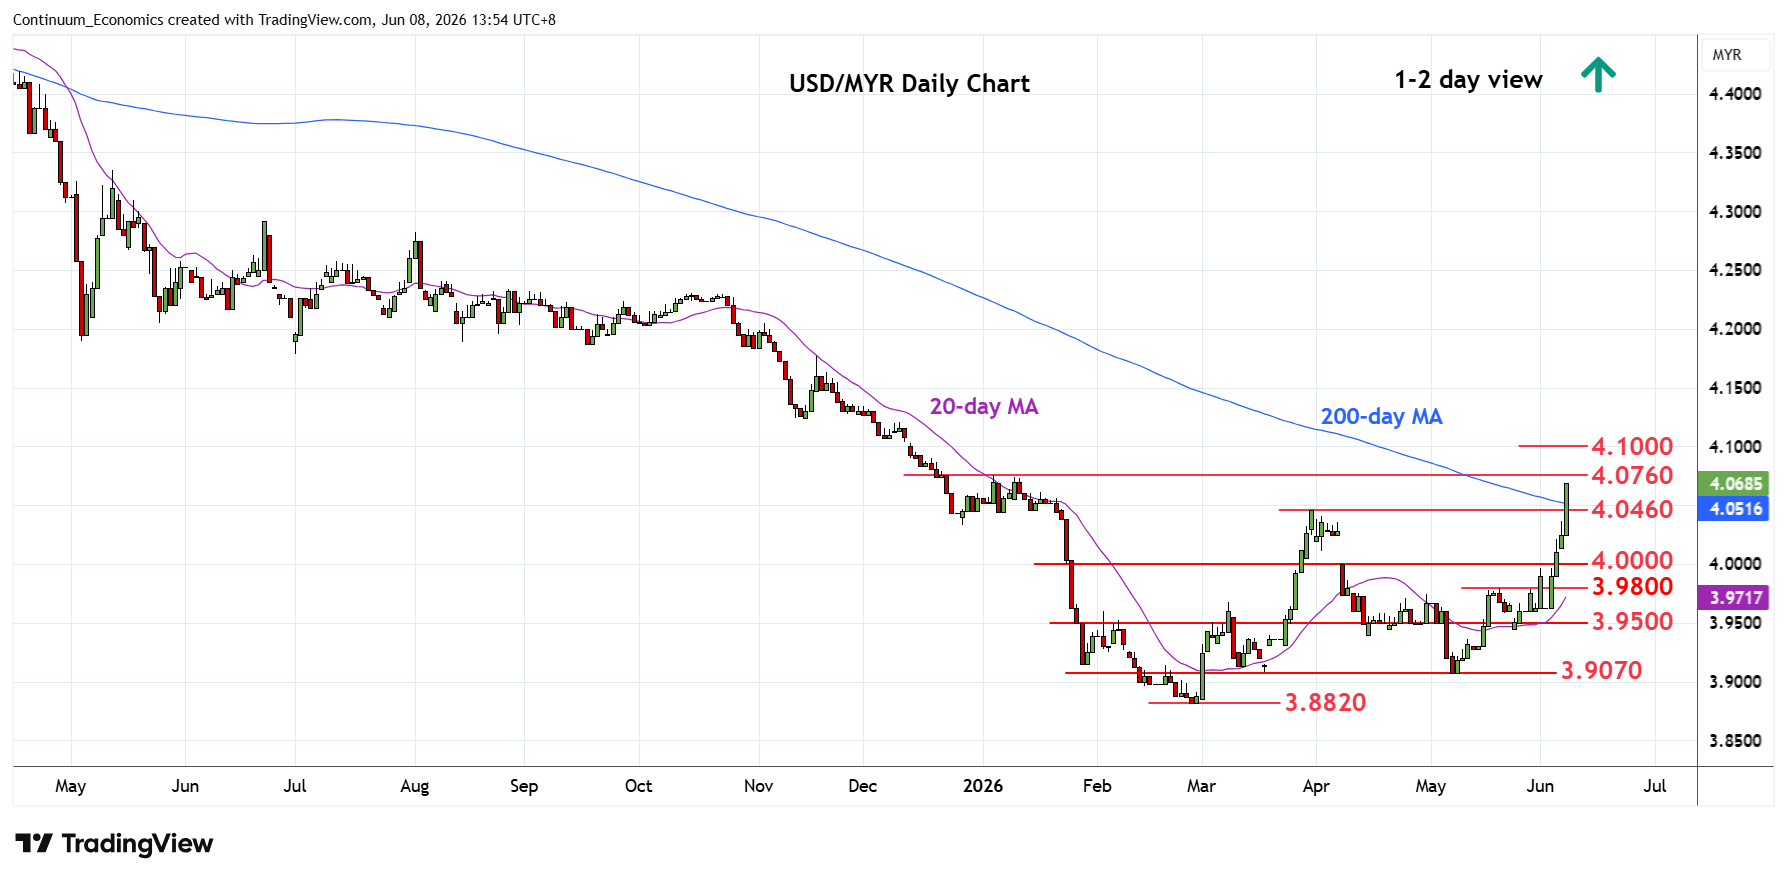
Chart USD/MYR Update: Poised for retest of 4.0760, January high
2
Break above the 4.0460 March high see prices extending gains from the 3.8820 February current year low
| Levels | Imp | Comment | Levels | Imp | Comment | |||
|---|---|---|---|---|---|---|---|---|
| R4 | 4.1240 | ** | Nov 2025 low, 38.2% | S1 | 4.0250 | intraday low | ||
| R3 | 4.1200 | * | congestion | S2 | 4.0000 | * | figure | |
| R2 | 4.1000 | ** | figure, 2024 yr low | S3 | 3.9800 | ** | May high | |
| R1 | 4.0760 | ** | 5 Jan YTD high | S4 | 3.9500 | * | congestion |
Asterisk denotes strength of level
06:00 GMT - Break above the 4.0460 March high see prices extending gains from the 3.8820 February current year low. Nearby see scope to target the 4.0760, 5 January YTD high. Break here will open up room for stronger correction of the sharp losses from 4.5165, 2025 year high, and see room to strong resistance at 4.1000, 2024 year low. Meanwhile, support is raised to 4.0250 intraday low and extending to the 4.0000 figure which should underpin and sustain bullish gains from the 3.9070 May low.