Published: 2026-06-02T05:38:45.000Z
Chart USD/INR Update: Consolidating losses
2
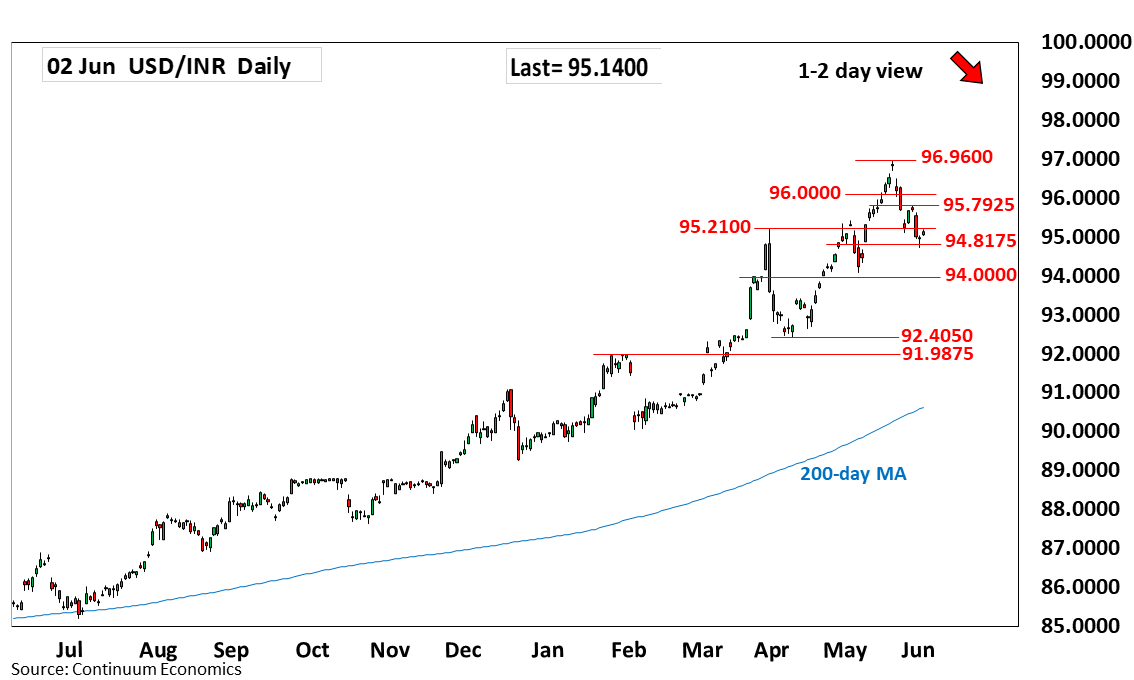
Turned up from the 94.7275 low as prices consolidate losses from the 96.9600 May all-time high
| Level | Comment | Level | Comment | |||||
|---|---|---|---|---|---|---|---|---|
| R4 | 96.9600 | ** | 20 May YTD high | S1 | 94.7275 | * | 1 Jun low | |
| R3 | 96.0000 | figure | S2 | 94.0800 | ** | May low | ||
| R2 | 95.7925 | ** | 27 May high | S3 | 93.4100 | ** | 15 Apr high | |
| R1 | 95.2100 | * | Mar high | S4 | 93.0000 | * | figure |
Asterisk denotes strength of level
05:35 GMT - Turned up from the 94.7275 low as prices consolidate losses from the 96.9600 May all-time high and unwind oversold intraday and daily studies. However, the downside still vulnerable and consolidation is expected to give way to renewed selling pressure later to retrace gains from the April low. Lower will see room for extension to strong support at 94.0800/94.0000, May low and congestion area. Meanwhile, resistance is lowered to the 95.2100 March high. Above here will see room for stronger corrective bounce to strong resistance at the 95.7925 high of last week.