Published: 2026-09-14T02:23:02.000Z
Chart USD/SGD Update: Room to extend corrective bounce
2
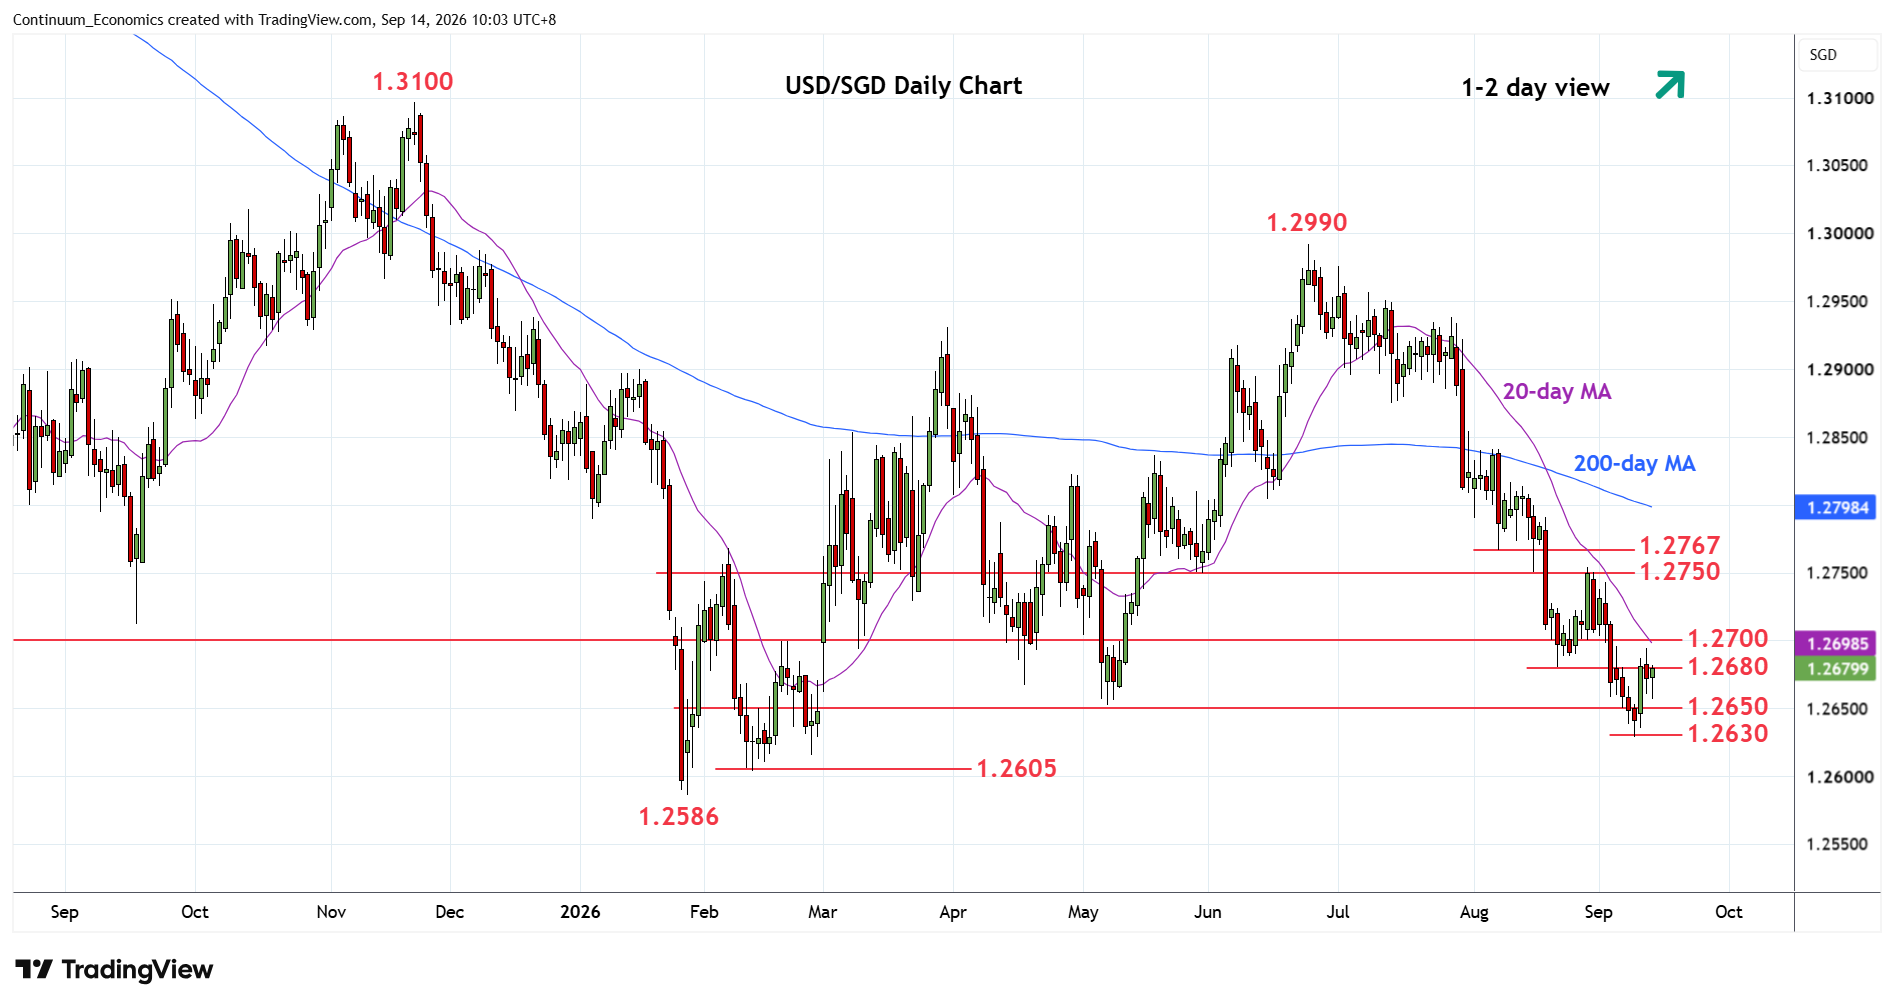
Consolidating test of resistance at the 1.2680/1.2700 area following bounce from the 1.2630 low
| Level | Comment | Level | Comment | ||||
|---|---|---|---|---|---|---|---|
| R4 | 1.2767 | ** | 7 Aug low, 38.2% | S1 | 1.2650 | * | May low |
| R3 | 1.2750 | * | congestion | S2 | 1.2630 | ** | 9 Sep low |
| R2 | 1.2700 | * | congestion | S3 | 1.2615/05 | * | 26, 12 Feb lows |
| R1 | 1.2680 | * | Aug low | S4 | 1.2586 | ** | 28 Jan YTD low |
Asterisk denotes strength of level
02:20 GMT - Consolidating test of resistance at the 1.2680/1.2700 area following bounce from the 1.2630 low. Intraday and daily studies are unwinding oversold readings and suggest scope for stronger gains to retrace losses from the June high. Above the 1.2700 level will see room to strong resistance at 1.2750 congestion then 1.2767, 7 August low and 38.2% Fibonacci level. Corrective gains are expected to give way to renewed selling pressure later. Below the 1.2650/30 area will see room for retest of the 1.2615/05 February lows then 1.2586 January current year low.