Published: 2026-08-18T04:20:44.000Z
Chart USD/IDR Updates: Scope for retest of 17770 low
7
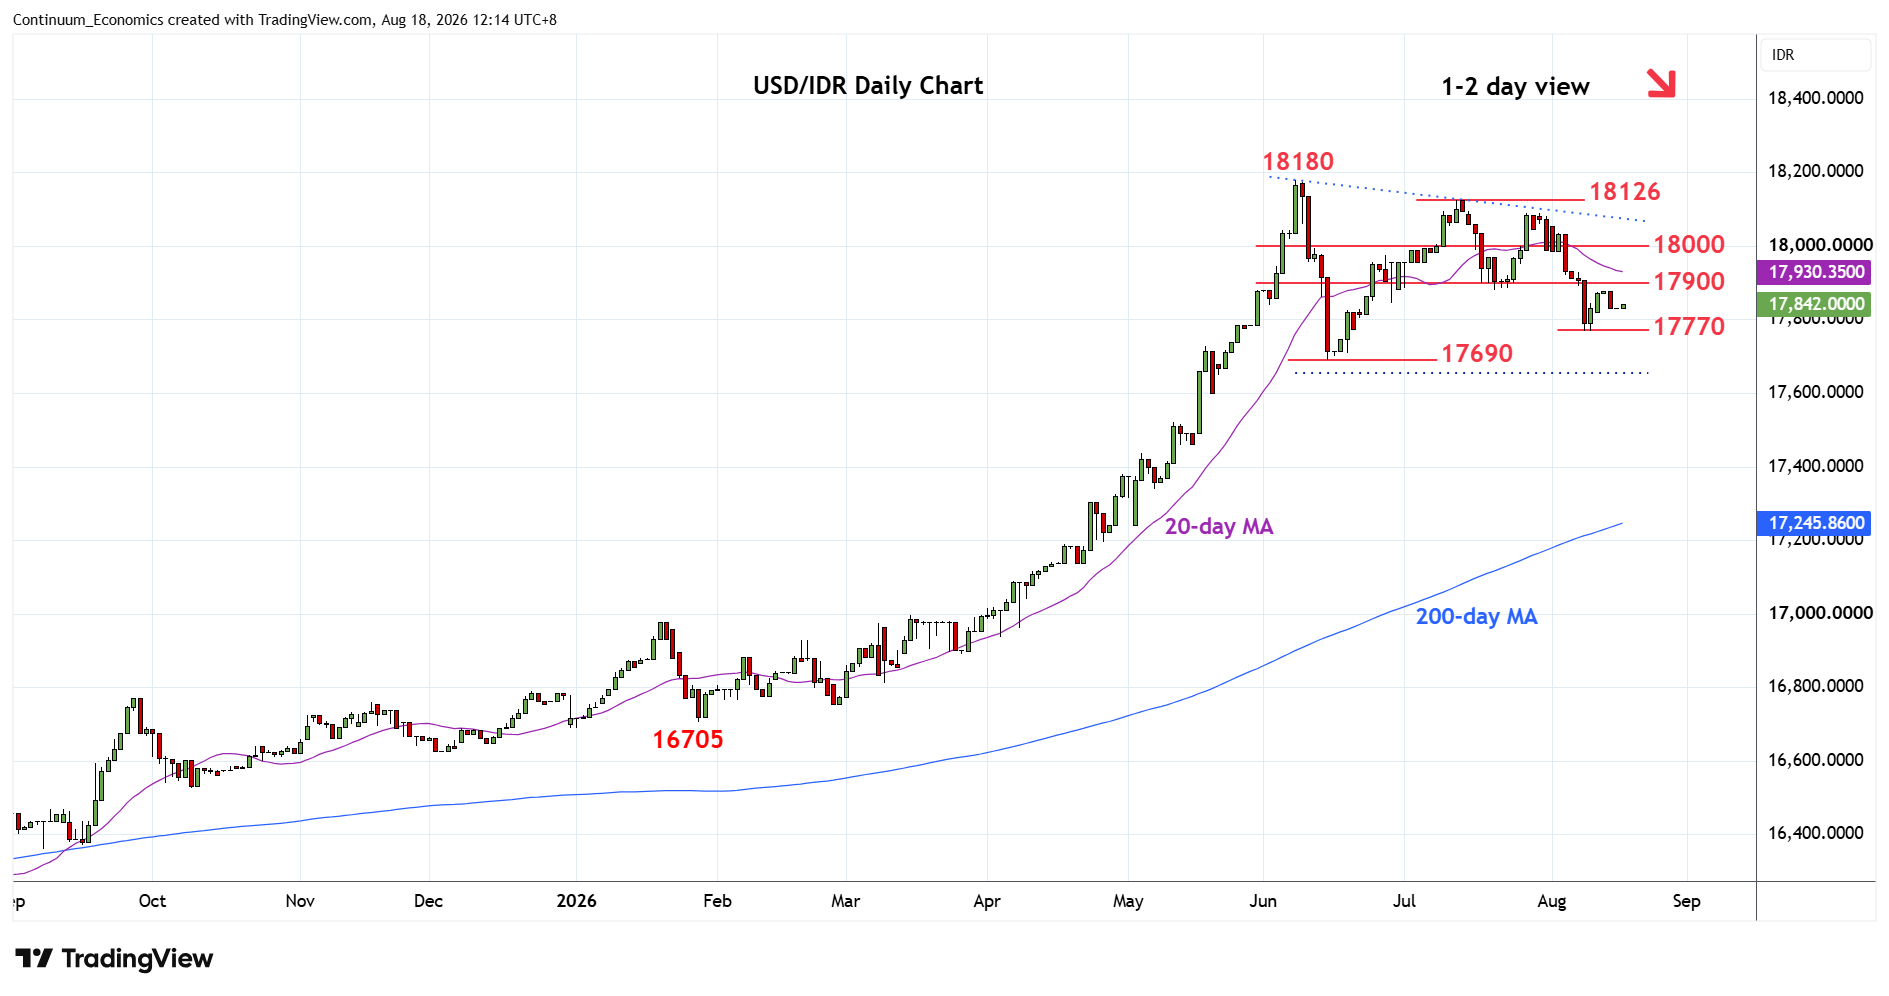
Settled back from test of the 17880/17900 resistance and pullback see room to retest the 17800 level then the 17770 low
| Levels | Imp | Comment | Levels | Imp | Comment | |||
|---|---|---|---|---|---|---|---|---|
| R4 | 18126 | ** | 13 Jun high | S1 | 17770 | ** | 10 Aug low | |
| R3 | 18090 | ** | 28 Jul high | S2 | 17690 | ** | Jun low | |
| R2 | 18000 | * | congestion | S3 | 17600 | * | 20 May low | |
| R1 | 17900 | * | congestion | S4 | 17520 | * | 12 May high |
Asterisk denotes strength of level
04:20 GMT - Settled back from test of the 17880/17900 resistance and pullback see room to retest the 17800 level then the 17770 low. Break of these will extend losses from the 18126 high of July and see room for extension to retest the 17690, June low. Below the latter will extend losses from the June current year high at 18180 to retrace gains from the August 2025 low. Lower will see deeper pullback to support at 17600 low of 20 May. Lower still, will open up room to 17520/17500 area. Meanwhile, resistance at 17880/17900 area expected to cap and sustain losses from the July high.