Published: 2026-07-22T02:39:04.000Z
Chart USD/SGD Update: Consolidating
1
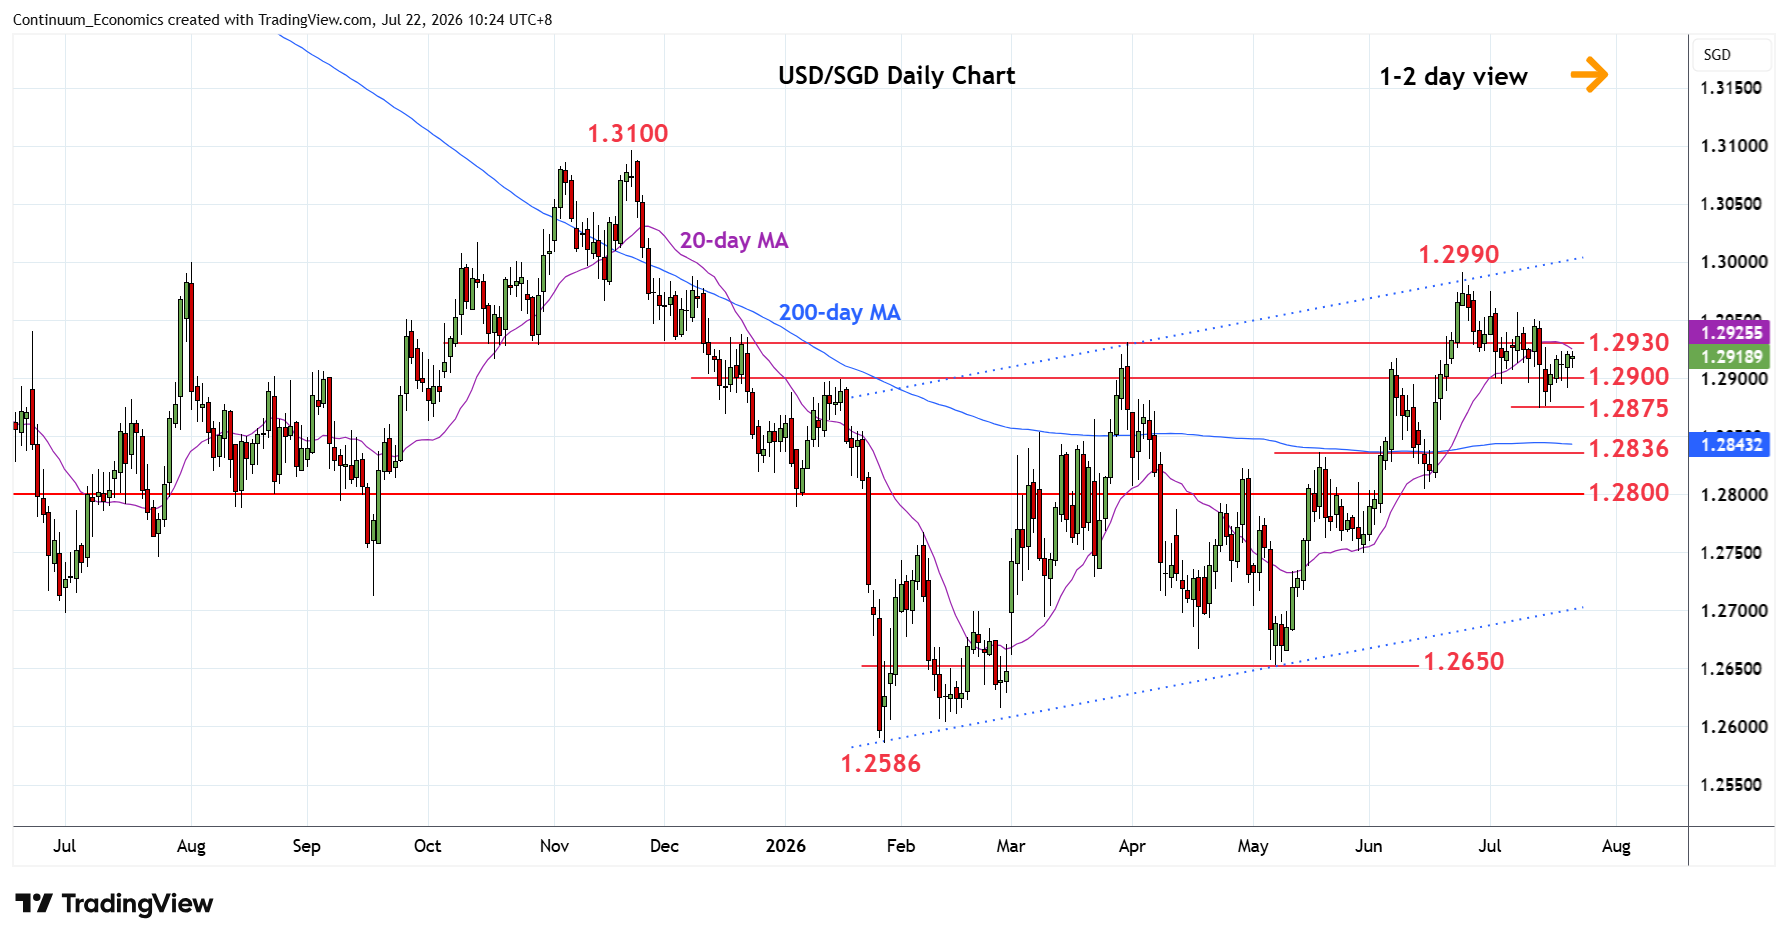
Turned up from the 1.2875 low as prices consolidate losses from the 1.2990 June current year high
| Level | Comment | Level | Comment | ||||
|---|---|---|---|---|---|---|---|
| R4 | 1.3000 | * | figure, congestion | S1 | 1.2875 | * | 14 Jul low |
| R3 | 1.2990 | ** | 24 Jun YTD high | S2 | 1.2850 | * | congestion |
| R2 | 1.2950 | * | congestion | S3 | 1.2836 | ** | May high |
| R1 | 1.2930 | * | Mar high | S4 | 1.2805/00 | ** | 15 Jun low, congestion |
Asterisk denotes strength of level
02:35 GMT - Turned up from the 1.2875 low as prices consolidate losses from the 1.2990 June current year high. Consolidation is expected to give way to renewed selling pressure later to retrace gains from the May swing low. Below the 1.2875 low will see room for deeper pullback to strong support at the 1.2850/36 congestion and May high. Would expect reaction here but a later break cannot be ruled out to the 1.2805 low of 15 June. Meanwhile, resistance at the 1.2930 March high is expected to cap corrective bounce.