Published: 2026-05-18T02:13:44.000Z
Chart USD/SGD Update: Retest 1.2823 resistance
2
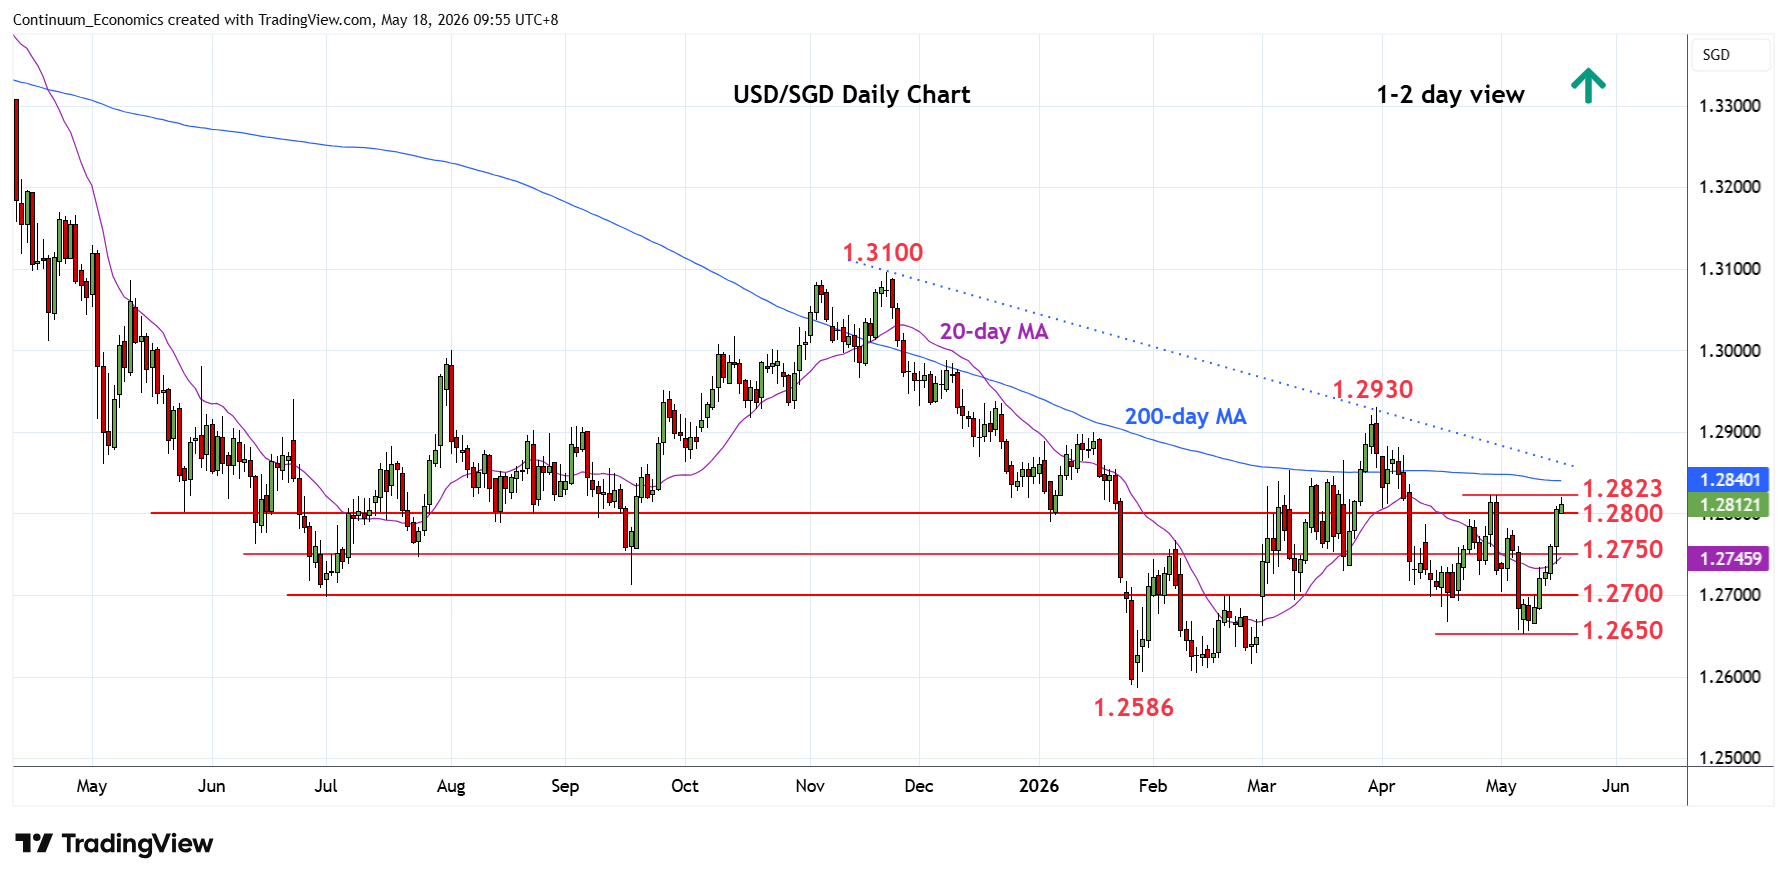
Extending stong rally from above the 1.2650 support last week to reach the 1.2823 resistance
| Level | Comment | Level | Comment | ||||
|---|---|---|---|---|---|---|---|
| R4 | 1.2900 | * | congestion | S1 | 1.2750 | * | congestion |
| R3 | 1.2860 | ** | Nov trendline | S2 | 1.2700 | * | congestion |
| R2 | 1.2840 | * | 200-day MA | S3 | 1.2667 | * | Apr low |
| R1 | 1.2823 | ** | 29 Apr high | S4 | 1.2650 | ** | 7 May low |
Asterisk denotes strength of level
02:00 GMT - Extending stong rally from above the 1.2650 support last week to reach the 1.2823 resistance. Overbought intraday studies suggest reaction here likely but a later break cannot be ruled out to open up room for stronger gains to the 200-day MA at 1.2840 and the trendline from the November high at 1.2860. Break of these, if seen, will turn focus to the 1.2930, current year high of 31 March. Meanwhile, support remains at the 1.2750 congestion which should now underpin and sustain strong bounce from the 1.2650, 7 May low.