Chart USD/MXN Update: Extending gains
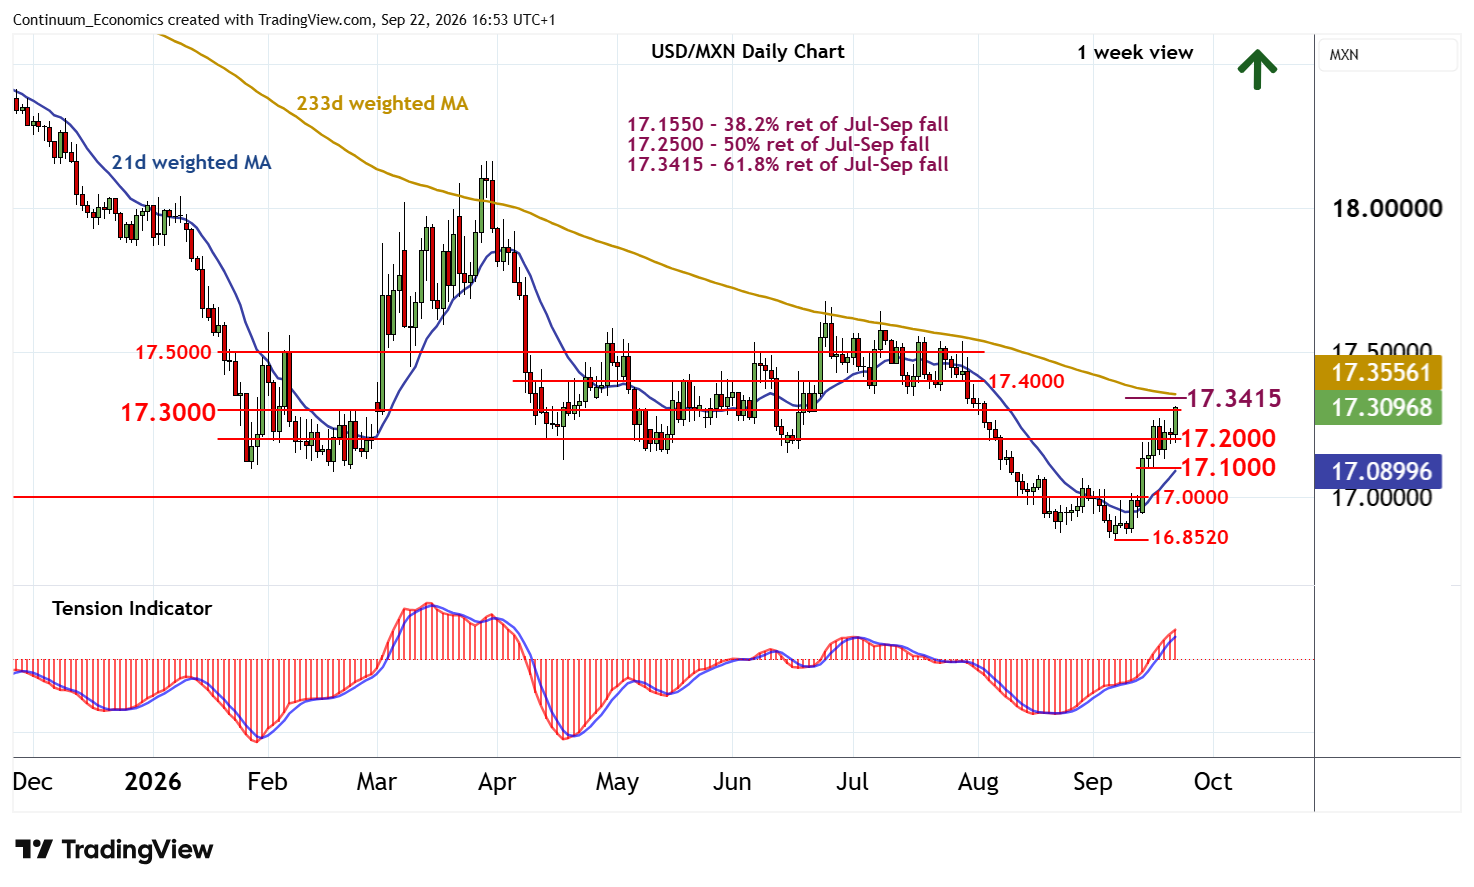
Cautious trade within the 17.1000 - 17.2000 range has given way to anticipated gains
| Levels | Imp | Comment | Levels | Imp | Comment | |||
|---|---|---|---|---|---|---|---|---|
| R4 | 17.5000 | ** | break level | S1 | 17.2000 | * | break level | |
| R3 | 17.4000 | * | range lows | S2 | 17.1000 | * | recent range lows | |
| R2 | 17.3415 | ** | 76.4% ret of Jul-Sep fall | S3 | 17.0000 | ** | congestion | |
| R1 | 17.3000 | * | break level | S4 | 16.9000 | congestion |
Asterisk denotes strength of level
16:30 BST - Cautious trade within the 17.1000 - 17.2000 range has given way to anticipated gains, with prices currently pressuring resistance at 17.3000. Just higher is the 17.3415 Fibonacci retracement. A tick higher in overbought daily stochastics and the positive daily Tension Indicator, alongside improving weekly charts, highlight room for further strength in the coming sessions. A close above here will further improve sentiment and extend gains from the 16.8520 current year low of 7 September towards congestion within the broad 17.4000 - 17.5000 range. Initial tests of here could give way to profit-taking/consolidation.
Meanwhile, support is raised to 17.2000 and extends to 17.1000. This broad range should underpin any immediate setbacks.