Published: 2026-07-08T05:02:09.000Z
Chart USD/INR Update: Settled back from 95.5000 high
1
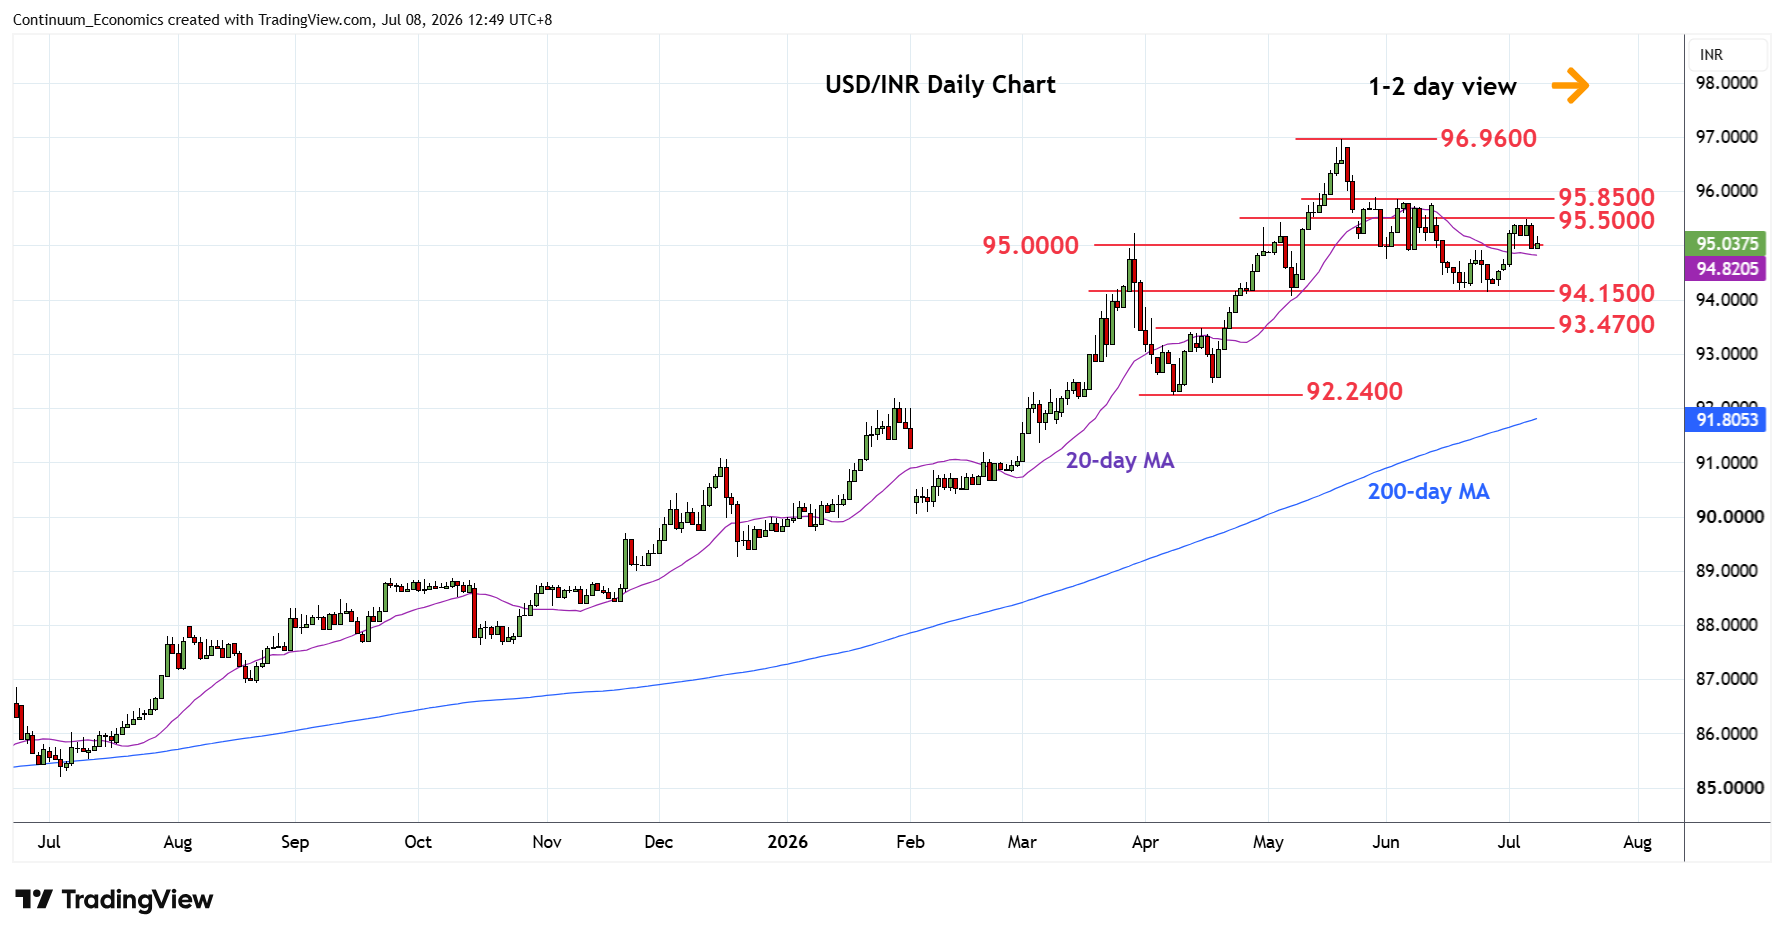
Consolidation at the 95.5000 high has given way to selling pressure to reach support at the 95.0000 congestion
| Level | Comment | Level | Comment | |||||
|---|---|---|---|---|---|---|---|---|
| R4 | 96.3000 | 22 May high | S1 | 95.0000 | * | congestion | ||
| R3 | 96.0000 | * | figure | S2 | 94.1500 | ** | Jun low | |
| R2 | 95.8500 | ** | Jun high | S3 | 94.0000 | figure | ||
| R1 | 95.5000 | * | 6 Jul high | S4 | 93.4700 | ** | 15 Apr high |
Asterisk denotes strength of level
05:00 GMT - Consolidation at the 95.5000 high has given way to selling pressure to reach support at the 95.0000 congestion. Daily studies have turned lower to unwind overbought readings and break of the later will return focus to the 94.1500 June low. Below here will see scope to extend losses from the May current year high and see extension to strong support at 93.4700 mid-April high. Meanwhile, resistance at 95.5000 high is expected to cap. Clearance, if seen, will open up room for stronger bounce to resistance at the 95.8500/96.0000 June high and congestion area.