Published: 2026-06-05T05:37:03.000Z
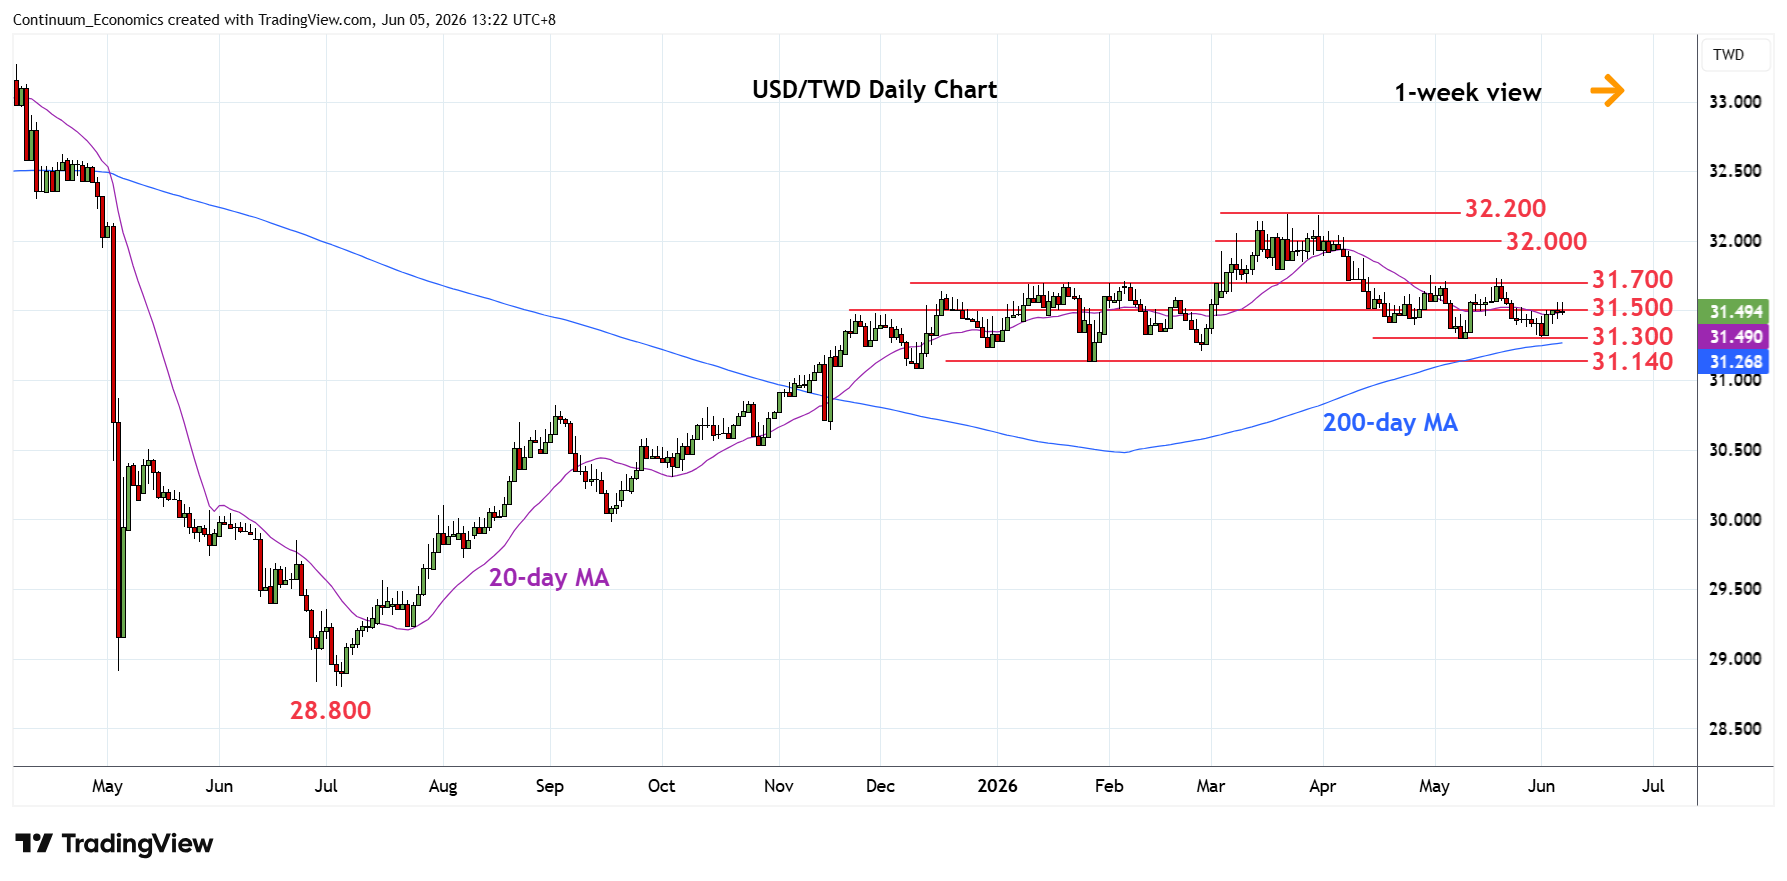
Chart USD/TWD Update: Choppy within 31.700/31.300 range area
1
Turned up from support at the 31.300 May low as prices consolidate losses from the 32.200 March current year high
| Levels | Imp | Comment | Levels | Imp | Comment | |||
|---|---|---|---|---|---|---|---|---|
| R4 | 32.000 | * | figure | S1 | 31.400 | * | congestion | |
| R3 | 31.800 | ** | congestion | S2 | 31.300 | ** | May low | |
| R2 | 31.700 | ** | Jan, Feb highs | S3 | 31.200 | * | Feb low | |
| R1 | 31.600 | * | congestion | S4 | 31.140 | ** | 27 Jan YTD low |
05:30 GMT - Turned up from support at the 31.300 May low as prices consolidate losses from the 32.200 March current year high. Further choppy action within the 31.700/31.300 range area can be expected before giving way to renewed selling pressure later. Break of 31.300 May low will see room to strong support at 31.200 February low and the 31.140 January YTD low. Break here will see deeper pullback to retrace gains from the July 2025 year low. Meanwhile, resistance at the 31.600/31.700 congestion area are expected to cap and sustain losses from 32.200 high.