Published: 2026-05-25T04:43:32.000Z
Chart USD/IDR Updates: Room to extend gains
3
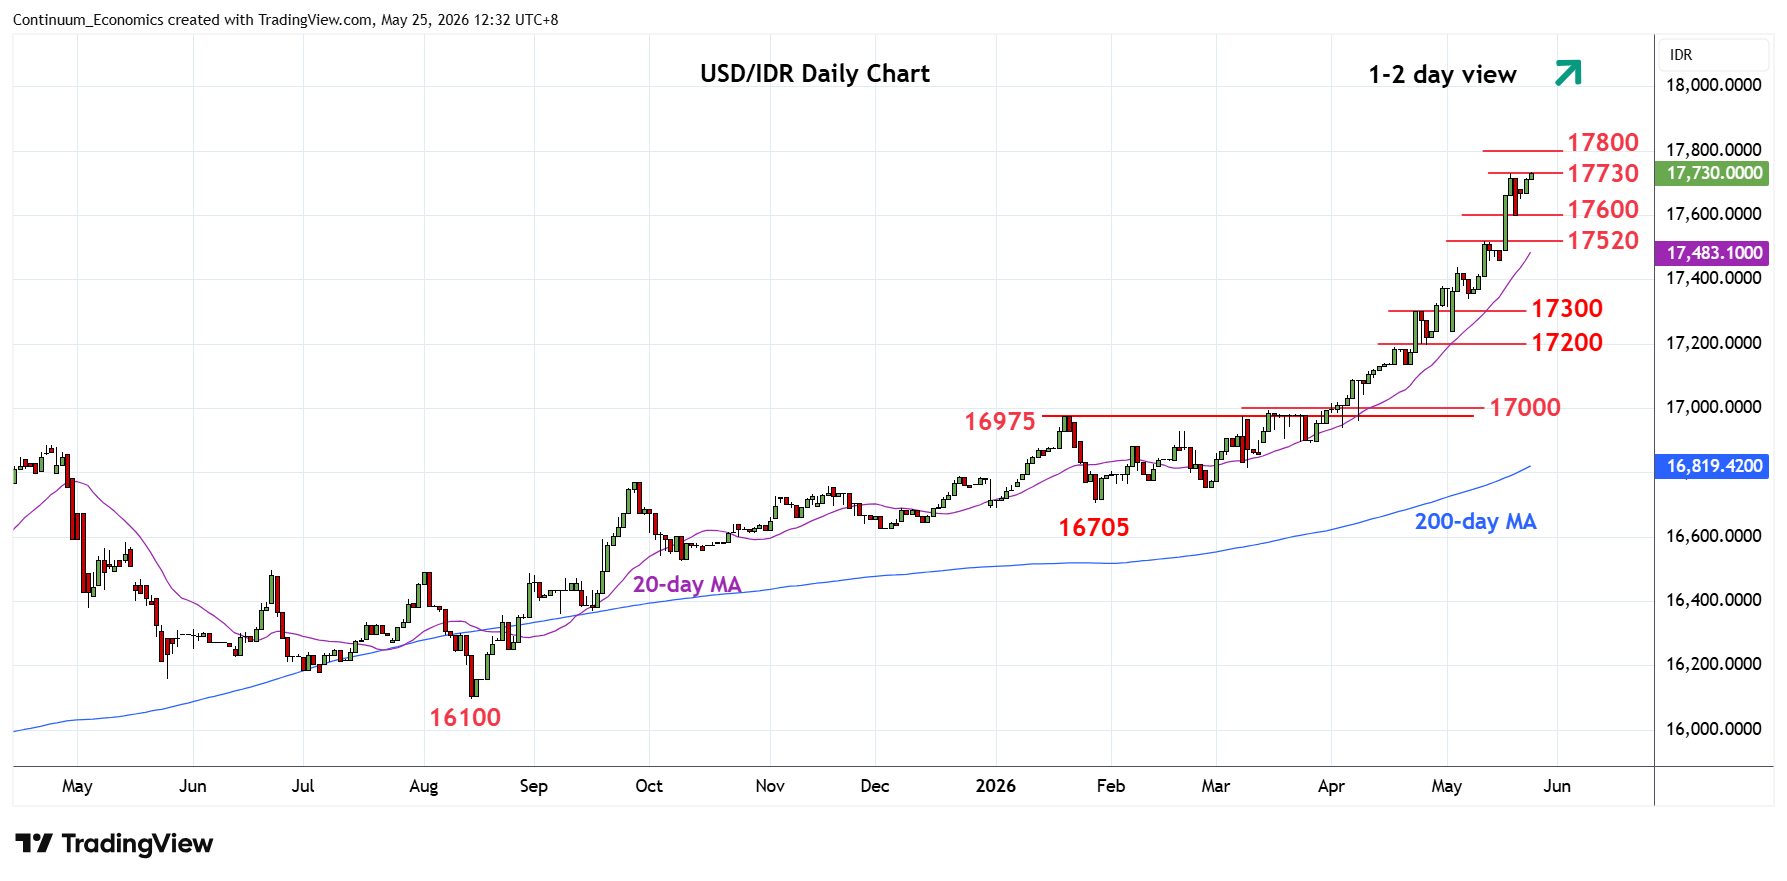
Consolidation below the 17730 historic high has given way to renewed buying interest following shallow pullback to the 17600 support
| Levels | Imp | Comment | Levels | Imp | Comment | |||
|---|---|---|---|---|---|---|---|---|
| R4 | 18500 | figure | S1 | 17600 | congestion | |||
| R3 | 18000 | ** | figure | S2 | 17520 | * | 12 May high | |
| R2 | 17800 | projection | S3 | 17437 | * | 5 May high | ||
| R1 | 17730 | ** | 19 May all-time high | S4 | 17300 | * | 23 Apr high |
Asterisk denotes strength of level
04:35 GMT - Consolidation below the 17730 historic high has given way to renewed buying interest following shallow pullback to the 17600 support. Break above the 17730 high will see room for extension to 17800 projection target then the 18000 figure where reaction can be expected as daily and weekly studies stretched into overbought areas. Meanwhile, support remains at 17600 low of 20 May. Below this will see room for deeper pullback to support at 17520 where break will ease the upside pressure and see room for deeper corrective pullback to retrace gains from the January low.